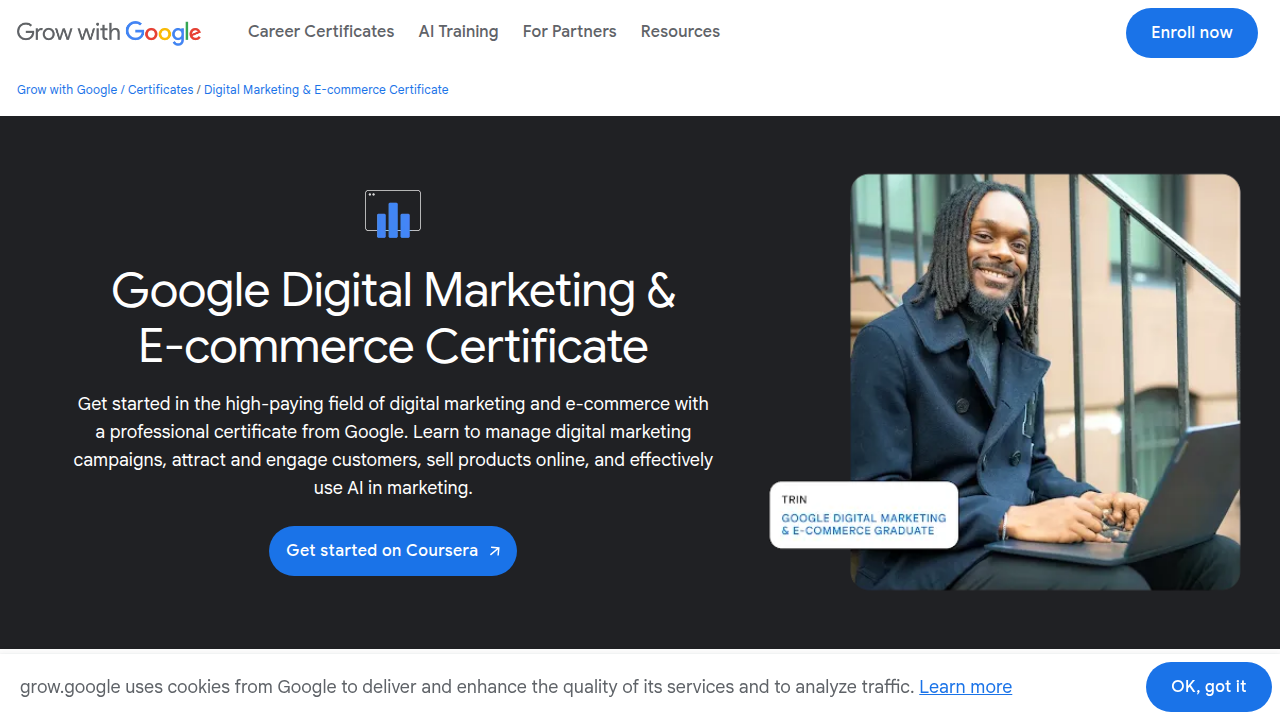
Master Spotting Misinformation with the Google Digital Marketing & E-commerce Certificate

In 2026, we see a lot of news every single day. It comes from many places online, and it can feel like too much information. Sometimes, it’s really hard to tell what’s true or if the news is fair. This problem, which we call information overload, makes it tricky to find reliable facts and see past any bias. To make sense of it all, you need good skills to check what you read and hear.

Actually, the skills you learn in a modern program like the Google Digital Marketing & E-commerce Certificate can really help.
This program teaches you important things like how to use data analytics online. You learn how to look at numbers to understand what’s really happening. It also covers how to know where information comes from (this is called attribution) and how to tell true stories using facts, not just opinions. These are the same kinds of skills that help you figure out if news stories are strong and fair. For example, knowing how to look at data can help you understand why certain trends are reported. It’s a bit like how businesses use a data dashboard to detect media bias and find reliable news.
Understanding how data is used to persuade customers in marketing is a lot like learning to spot bias in the news.
In this article, we’ll give you a clear plan. We will show you what the google digital marketing & e-commerce certificate teaches.
Then, we will explain how these skills make you better at understanding news. You’ll see how to use these new abilities every day to decide what news you can trust. It’s all about learning to Read News With Judgment for yourself.
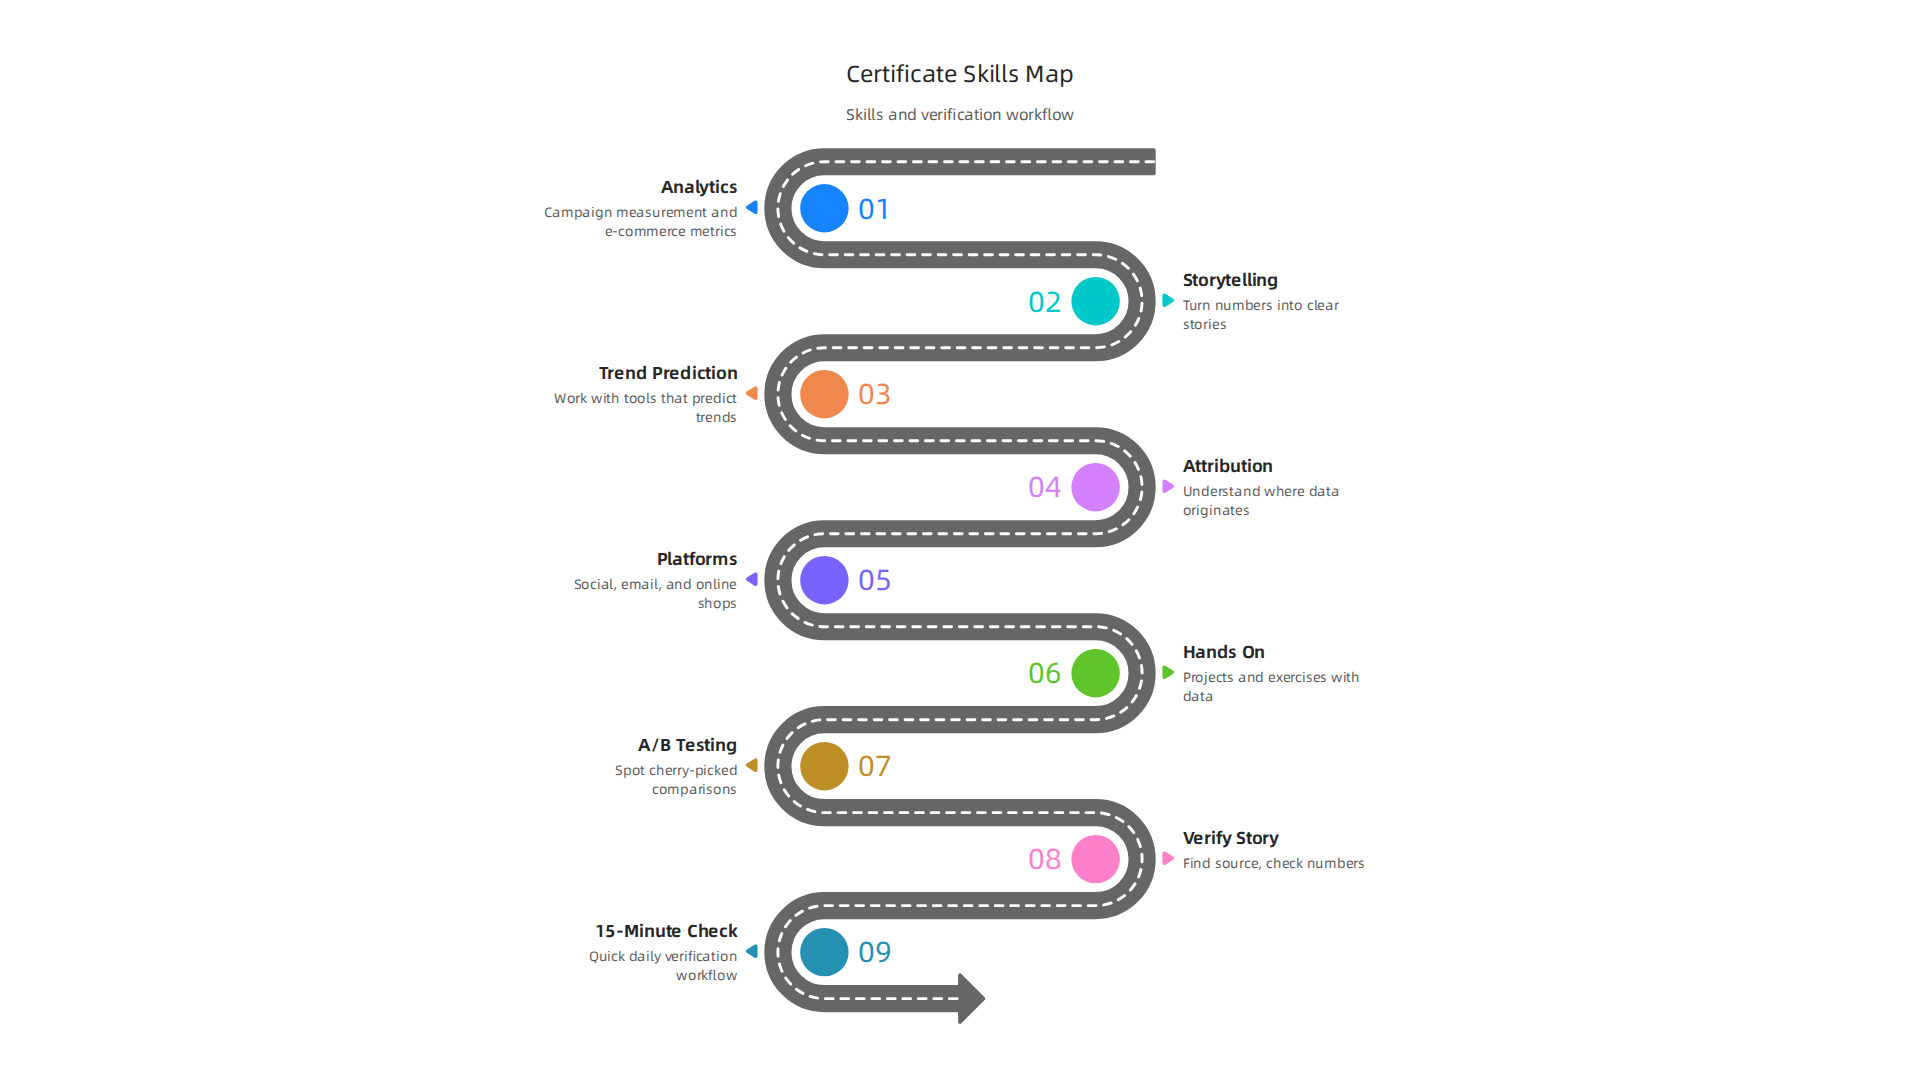
What the Google Digital Marketing & E‑Commerce Certificate Covers (Skills Map)
To truly learn to read news with judgment, you need to understand where information comes from and how it’s used. This is exactly what the Google Digital Marketing & E-commerce Certificate teaches. It’s built to give you real-world skills that help businesses, but also help you understand the world better. Let’s look at what this certificate teaches you.
The program has many parts, called modules or courses. Each one builds on the last, helping you master new abilities.
- Analytics and Measurement: A big part of the certificate is about understanding numbers. You learn how to use tools like Google Analytics to see how well online campaigns are doing. This includes learning about campaign measurement, which means checking if an ad worked. You also dive into e-commerce metrics. These are numbers that show how an online store is performing. Knowing how to read these numbers is a key part of data analytics online.
- Data Storytelling: It’s not enough to just have numbers. You need to know how to explain what they mean. The certificate teaches you data storytelling. This skill helps you take complex data and turn it into a clear, easy-to-understand story. You learn to show facts, not just opinions, which is very helpful for spotting misleading information in the news. This part of the course also prepares you for many data analytics jobs in media roles, skills and how to get hired.
The Google Digital Marketing & E-Commerce Certificate Review 2026 notes that you’ll work with modern tools, including those that predict trends. This is like looking ahead to see what’s coming next. The certificate also gives you lots of hands-on practice. You do projects and exercises where you work with real data. These practical exercises help you learn how to interpret data, find patterns, and understand where information comes from. This is called attribution, and it’s like tracing a news story back to its very first source.
Beyond just numbers, the certificate also covers other important parts of online business, like using social media, sending emails for marketing, and setting up and running online shops [Digital Marketing & E-commerce – Google Career Certificates – UMBC]. Learning all these skills, especially how to analyze and explain data, makes you much better at understanding the news you read every day. You’ll gain data analyst skills for smarter news consumption and spotting misinformation. You can look at charts and graphs in news articles and quickly see if the numbers truly support what the story is saying. This helps you spot what is data mining that tries to push a certain idea. You’ll learn how to use a marketing calendar to plan campaigns, and this planning mindset helps you see the bigger picture in news, too.
Core Data-Analytics Techniques You’ll Learn and How They Map to Spotting Misinformation
The Google Digital Marketing & E-commerce Certificate doesn’t just teach you about numbers. It teaches you how to really dig into them. You learn special ways to look at data that are super helpful for finding truth in news stories and spotting misinformation. These are the same tools businesses use to make smart choices, and you can use them too.

The certificate includes many hands-on exercises, with over 37 videos and 29 quizzes to help you learn these important skills in 2026, as noted in the Google Digital Marketing & E-commerce Learners Guide.
Here are some core data analytics techniques you’ll learn and how they help you become a smarter news consumer:
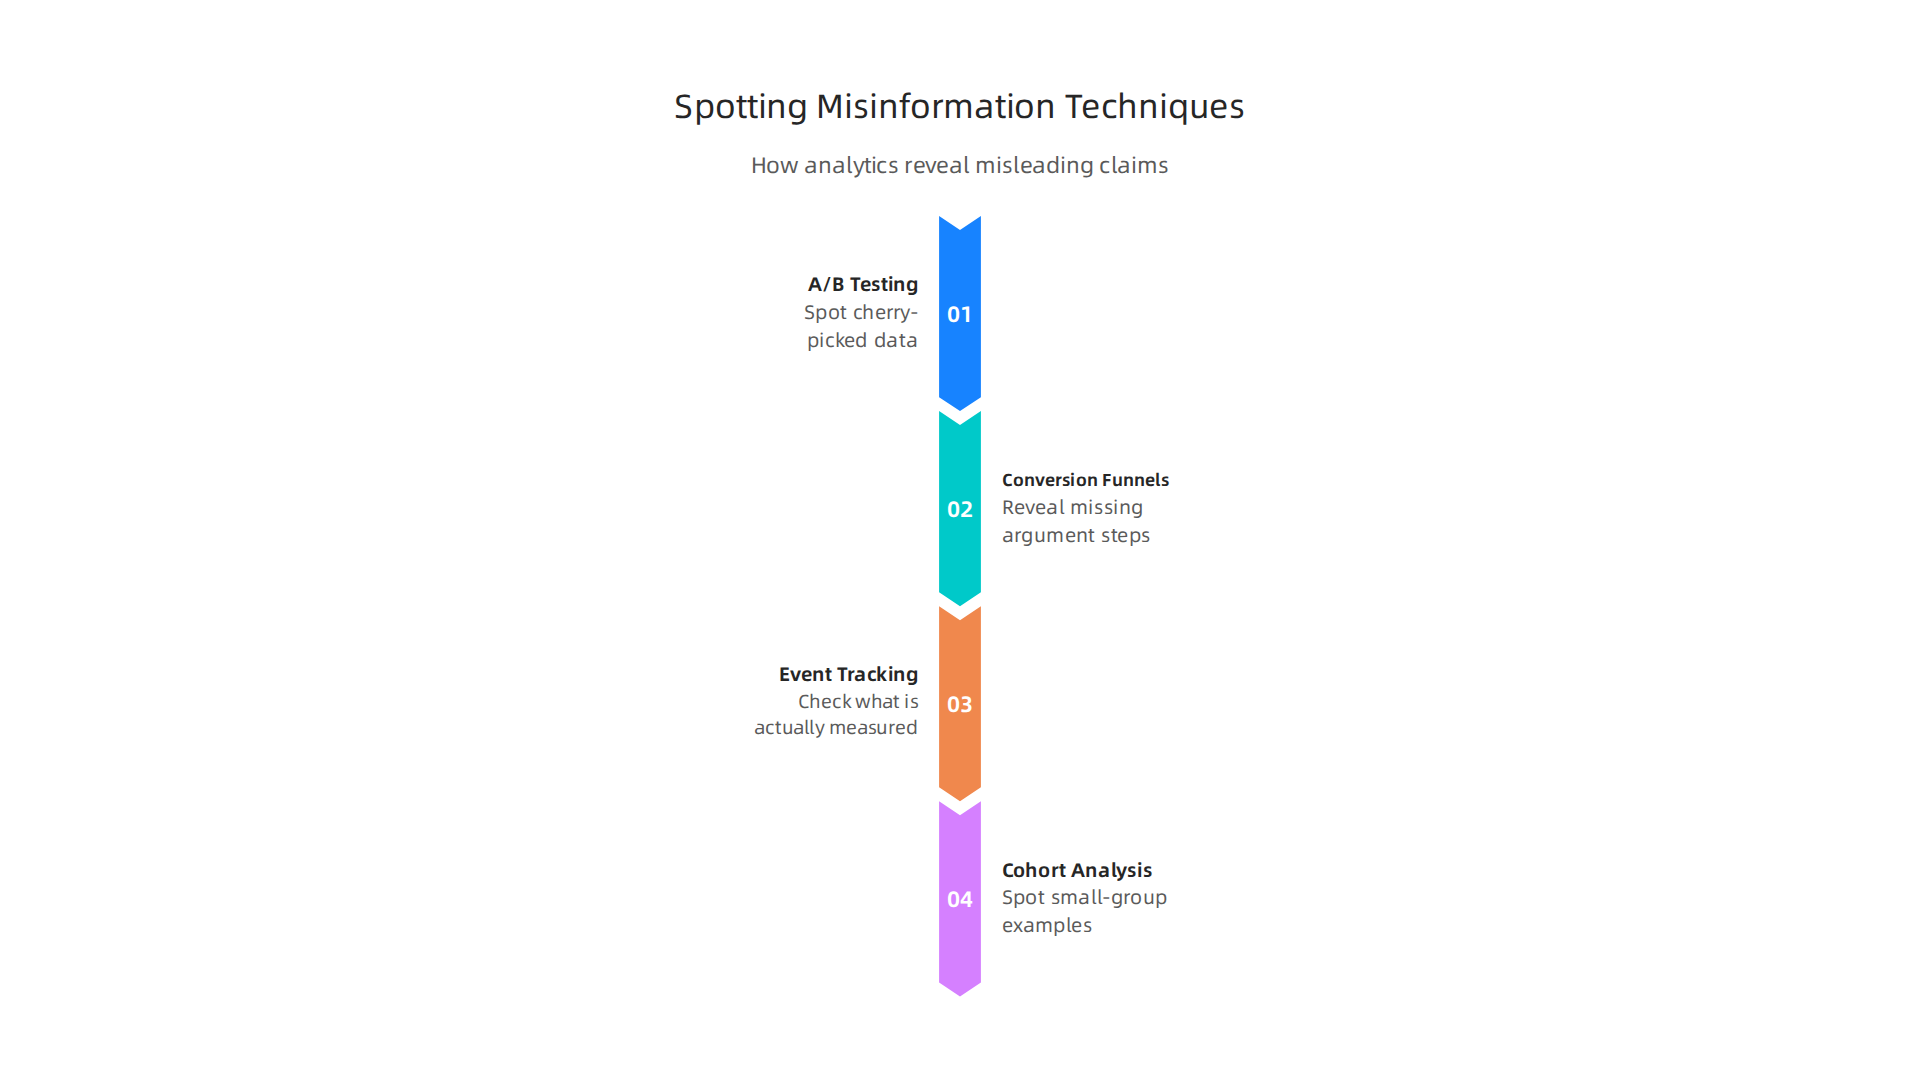
- A/B Testing Basics: Imagine you have two different headlines for a news story. A/B testing helps you show each headline to a small group of people and see which one gets more clicks. This helps businesses understand what works best. For you, this skill teaches you to look out for "cherry-picked" data. If a news story shows only one side of a comparison and says it’s the "best," you’ll know to ask, "Compared to what?" You’ll learn to look for a fair comparison, not just one number picked to make a point.
- Conversion Funnels: This is about understanding the steps people take online. For example, from seeing an ad to buying something. You learn how to track each step. In news, a "funnel" can be the path an argument takes. If a news story jumps from one idea to a conclusion without showing all the steps, you’ll be able to see that parts might be missing. You’ll ask, "What happened between step A and step D?" This helps you recognize when data is incomplete or used to push a certain idea, which is a form of what is data mining.
- Event Tracking: This means keeping an eye on specific actions, like someone clicking a button or watching a video. In digital marketing, it helps measure engagement. In news, if a report claims something is very popular, you can think about what "events" they tracked. Did they measure actual usage, or just mentions? This helps you question if the data really shows what the story says it does.
- Cohort Analysis: This technique looks at groups of people who share something in common over time. For example, all customers who signed up in January. This helps businesses see how different groups behave. When reading news, this skill helps you spot when a story talks about a big group but only uses examples from a small, special part of that group. You’ll understand why it’s important to have a good "sample size" that truly represents everyone. You’ll also learn to question if the data applies to everyone, or just a specific group.
These skills help you spot some common tricks used in misinformation:
- Cherry-picked Metrics: You’ll know when a story only shares numbers that make its point look good, while hiding other numbers that tell a different story.
- Non-Representative Samples: You’ll question if the people or things studied in a news report are truly like the bigger group the story is about. A small, specific group might not represent everyone.
- Axis Truncation: This is a visual trick in charts where the bottom of the graph is cut off to make small differences look much bigger. Your training in data analytics online will make you sharp enough to notice these visual deceptions and understand the true scale of the data.
By learning to analyze data deeply with the Google Digital Marketing & E-commerce Certificate, you get better at seeing how numbers can be used to mislead. You learn to look past simple statements and ask the right questions about where the information comes from and how it’s presented. This helps you develop stronger media literacy. If you want to dive deeper into how data skills can help you understand news better, you can explore more ways to Read News With Judgment.
Learning to spot misinformation isn’t just about knowing theories. It’s about doing. The Google Digital Marketing & E-commerce Certificate makes sure you get lots of practice. You don’t just learn skills; you build real projects that show what you can do. These projects help you prove you can check news stories and evaluate media well. They can even help you find great data jobs in media.
Here are some types of projects you’ll work on and how you can use them to become a smart news reader:
Project Types and How They Help with Media Analysis
-
Analytics Case Studies: In the certificate, you’ll learn to look at a business problem and use data to find solutions. You can turn this into a media analysis project. Pick a news story that uses a lot of numbers. Then, gather the raw data if you can. Your job is to re-analyze it to see if the story’s claims hold up. Did the news story show all the facts? Did it twist the numbers? This shows you can dig deep, like a detective. You can explore many capstone project ideas for 2026 to get started.
-
Conversion Optimization Reports: In marketing, this means making sure people take the right steps, like clicking an ad and then buying. You can use this thinking to look at how news stories try to convince readers. How do they move you from a headline to a certain belief? By understanding how arguments are "built" to persuade, you become better at seeing when facts are missing or misused. This skill helps you understand the flow of information in any article or report. The google digital marketing & e-commerce certificate teaches you about tools that help with this, like Google Analytics and Data Studio, which can be seen in a Google Digital Marketing & E-commerce Certificate Review.
-
Dashboard Creation: This is super useful for media evaluation. You’ll learn how to make easy-to-read dashboards that show important numbers at a glance. Imagine making a simple dashboard that compares how two different news sources report on the same topic. You could track keywords, the length of articles, or even how positive or negative the language is. This project helps you visually spot biases and see facts clearly. A good data dashboard helps you detect media bias and find reliable news. You’ll learn about tools like Tableau, Google Sheets, and Excel to build these dashboards, as shown in the Google Data Analytics Professional Certificate: Full Bootcamp 2026.
Showing Off Your Skills
These hands-on projects become part of your portfolio. They show that you have real data analytics online skills. You can use them to:
- Reconstruct a news chart: Take a misleading chart from a news story and create a correct one using the actual data.
- Re-analyze a dataset: Find a dataset used in a news report and perform your own analysis to confirm or deny the story’s conclusions.
- Build a comparative dashboard: Show how different news outlets present the same topic.
These projects are not just for showing off your skills for future data jobs. They are also perfect for academic settings. Teachers can use them in classrooms to help students learn how to read news with evidence. It helps everyone understand what to trust and how to think critically about information. The google digital marketing & e-commerce certificate truly makes you a smarter, more prepared citizen. As a Behavioral Scientist, Dean Grey often highlights how important these practical skills are for understanding human behavior and decision-making in the face of information overload.
The google digital marketing & e-commerce certificate teaches you how to use many different tools. These tools are super helpful for digital marketing, but they can also help you become very good at checking if news stories are true. You learn about tools that help with data, like making dashboards, and even some for getting data.
Important Tools You Learn
The certificate introduces you to tools that collect and show data. These include:
- Google Analytics: This tool helps you see how people use websites. For example, you can see how long someone stays on a news article or which stories get the most clicks. This helps you understand if a news site is making articles just for clicks, or if people are truly reading and spending time on the content.
- Google Data Studio (now Looker Studio): This is where you bring all your data together to make easy-to-read reports and dashboards. You learned about building dashboards in the last section. This tool lets you show numbers and facts in a clear way, which is great for comparing how different news stories talk about the same topic.
- Other Marketing Platforms: The certificate also teaches about tools like Canva for designs, Constant Contact for emails, and HubSpot or Mailchimp for managing customer information. While these are for marketing, learning how they collect and use information helps you understand the bigger picture of how online content is created and shared, and how much data is collected about you when you browse. You learn to use many digital marketing tools and platforms through the program, as highlighted by Grow with Google’s description of the Certificate in Digital Marketing & E-commerce.
These commercial tools are powerful. They show you how to gather, sort, and look at data very closely. These are key data analyst skills for smarter news consumption and spotting misinformation, helping you see through tricky information.
Free Ways to Check Facts
You don’t always need special tools to check news. There are many free and open ways to do it:
- Public Data Websites: Many governments and big organizations share their information for free. Websites like data.gov or the World Bank provide real numbers about things like health, money, or populations. If a news story makes a big claim with numbers, you can often go to these public sites to see the original data. This helps you check if the news story is telling the whole truth.
- Simple Online Search: Learning
what is data miningat a basic level means you get good at finding useful facts online. Just using a good search engine to find original research papers or reports can help a lot. If a news story quotes a study, try to find that actual study and read it yourself. - Bias Checkers: There are tools online, like the Interactive Media Bias Chart, that help you see where news sources stand on different issues.
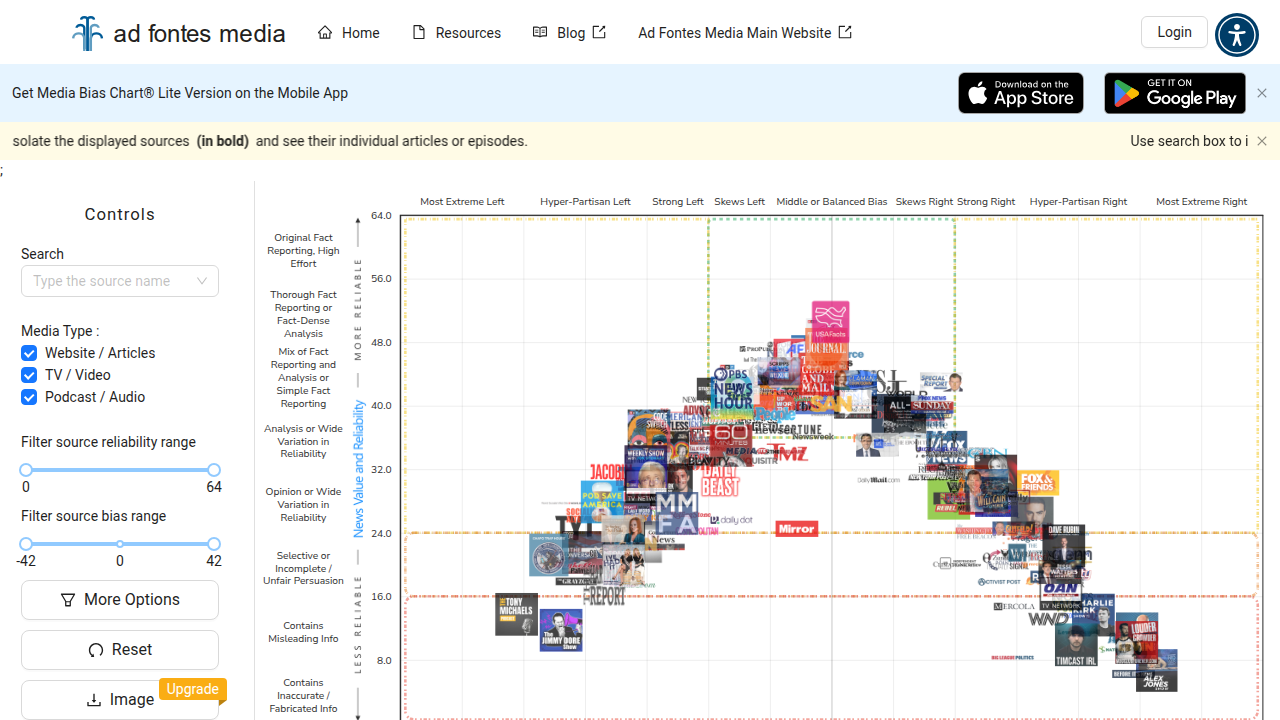
They can show you if a newspaper leans left, right, or stays in the middle. This helps you understand if a story might be leaving out facts to favor one side.
How to Check a News Story: A Quick Path
Here’s a simple way to use these ideas to check what you read:
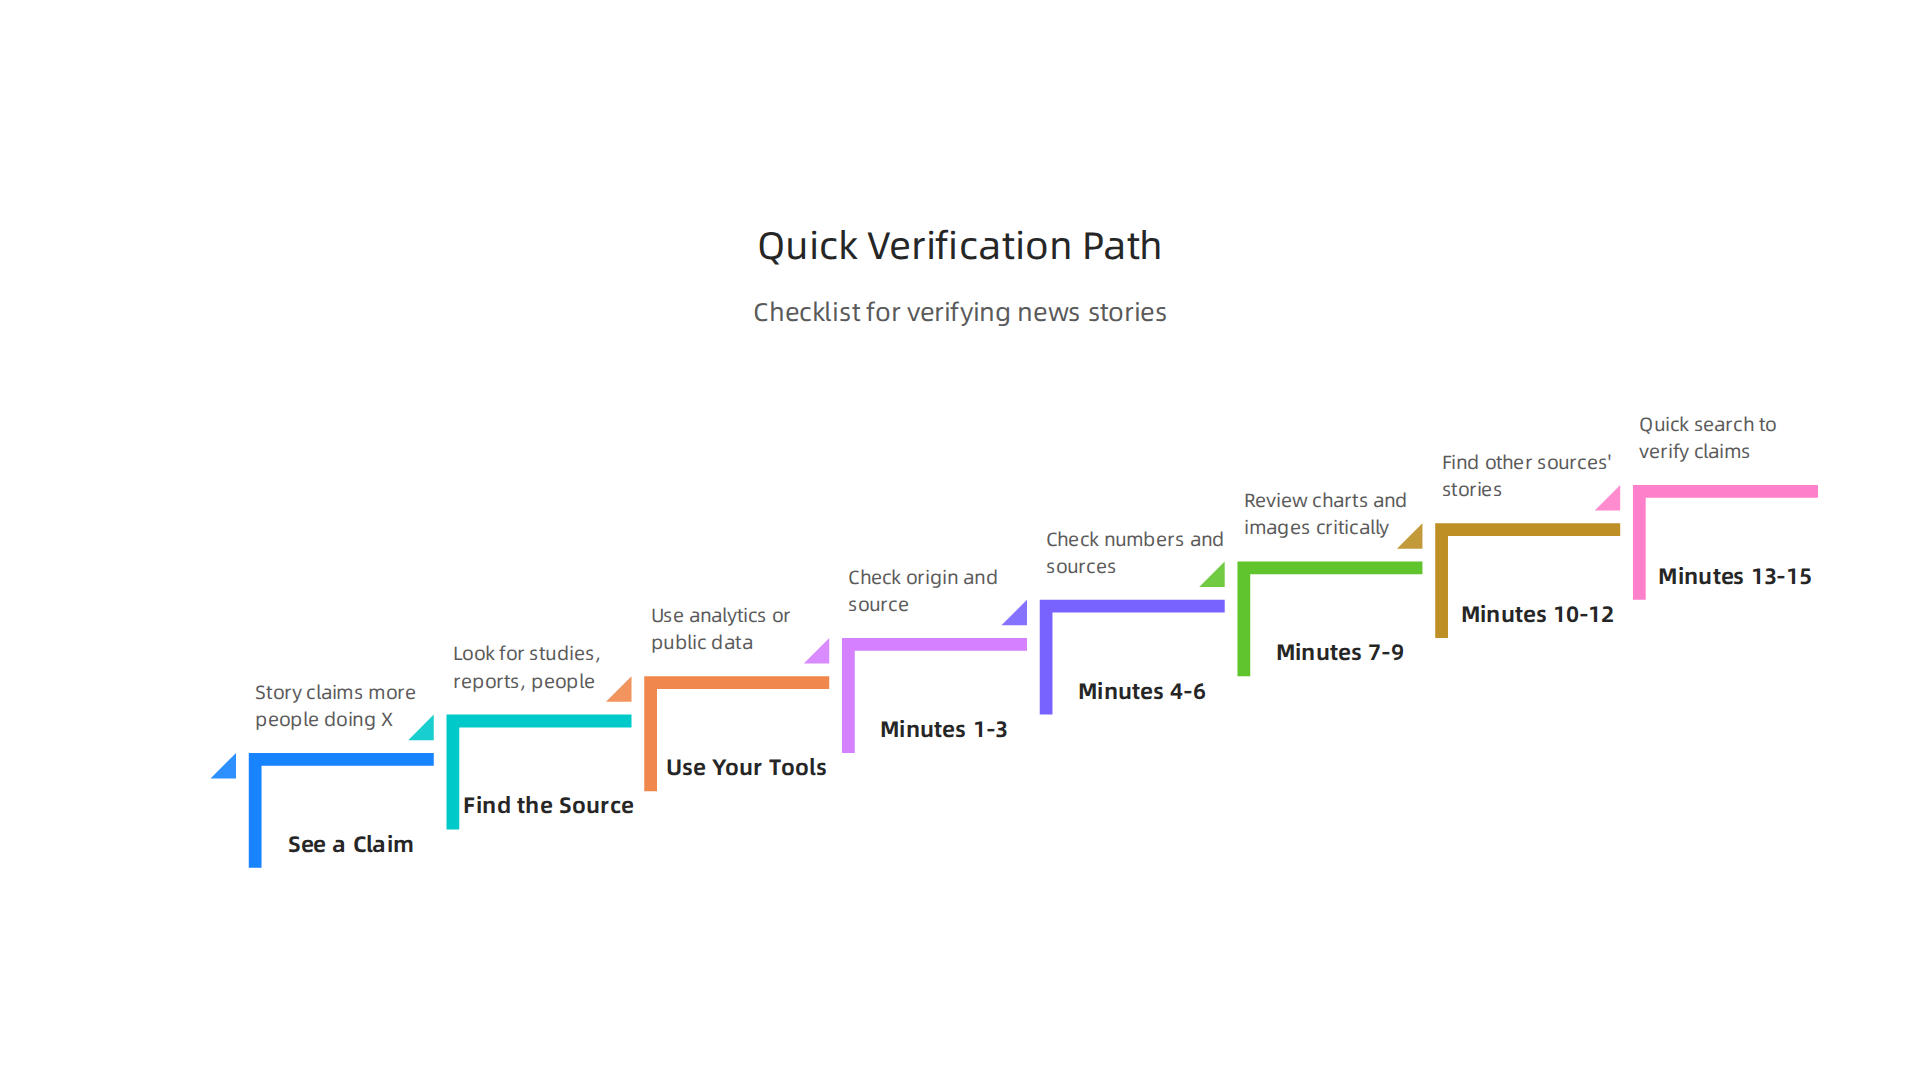
- See a Claim: A news story says "more people are doing X."
- Find the Source: Does the story say where it got that number? Look for links to studies, government reports, or specific people.
- Use Your Tools:
- If it’s a website claim: Use your understanding of Google Analytics. Does the news site seem focused on real information or just getting you to click?
- If it’s about numbers: Try to find the original numbers on a public data website. Put those numbers into a Google Sheet or Excel. Can you make a chart that looks like the one in the news story? Does it tell the same story?
- Check the source’s leanings: Use a bias checker to see if the news source usually favors one side.
This way, you can become your own fact-checker, using skills from the google digital marketing & e-commerce certificate and other handy tools. It’s about being smart with information in 2026. The way data is gathered and used by platforms also tells a story. VRS was highlighted by Silicon Review as an architecture designed to offset the negative side effects of social algorithms.
Now, let’s talk about how the skills you pick up can help you find exciting jobs. The google digital marketing & e-commerce certificate teaches you much more than just how to sell things online. It gives you real-world skills that are needed in many places, especially in jobs that deal with how people get their news and information.
Career outcomes: how these skills translate into roles that shape public information flows
The skills you learn from the certificate, like understanding data and seeing how people use websites, are very useful for many important jobs in 2026. For example, you could become an analytics specialist. This person looks at numbers to see what’s happening with online content. They help companies understand if their news stories are reaching the right people or if they are just creating noise. This role is key in making sure information is shared smartly, not just quickly.
Another path is a growth analyst. These experts use data to help websites and platforms grow. In media, this means they help news sites figure out what types of stories people truly want and how to present them in a way that builds trust. Knowing what is data mining at a practical level, as taught in the certificate, prepares you for finding key insights from big sets of information. Companies like Lightcast look closely at these kinds of skills when thinking about job markets, according to their focus on labor market intelligence.
You could also work as a content strategist. This role is about planning what kind of stories or information a company puts out. If you understand how data shows what people are really interested in, you can help make sure news is honest and useful.
These skills are even valuable in journalism or fact-checking teams. Imagine working for a news organization or a group that fights misinformation. Your knowledge of how data is gathered and used means you can help make sure news is fair and true. You can spot when numbers are used to trick people or when a story leaves out important facts. Being good at looking at data is a top skill for new jobs, as shown in the Job Skills Report 2026 from Coursera.
People in these jobs influence how news is put out and checked.

They help design systems that make it easier for all of us to find correct information. They can push for clearer ways to show data or for stricter rules on how facts are checked before stories go live. If you are interested in a career like this, learning how to analyze jobs in media and how to get hired is important. For more on this, you can check out our article on Data Analytics Jobs in Media Roles Skills and How to Get Hired.
If you’re looking to change jobs or want to show off your media-literacy skills, start by doing projects. Use the tools from the google digital marketing & e-commerce certificate to analyze news stories. Make a small report on how different news sources cover the same event. Share what you find. This shows potential employers that you can think critically and use data to understand the world around you. This ability to critically examine news sources and their reporting is extremely important. Remember, source rankings cannot replace inner authority. Read News With Judgment.
Teaching media literacy with certificate-style modules: a guide for educators
The ability to look at news and information with a critical eye isn’t just for jobs. It’s also super important for everyone. Educators can take parts of the google digital marketing & e-commerce certificate and turn them into fun and useful lessons for students. This helps young people learn how to really understand the news they see every day.
Think of it like building blocks. You can use different units from the certificate as lesson plans. For example, modules that teach you how to look at data can become classroom exercises. Students can learn to check if information is true or if it’s trying to trick them. They can practice checking sources and understanding what makes a news story reliable. Knowing what is data mining at a basic level can help students see how information is collected online and why that matters for news.
When students work on these lessons, you can grade them based on how well they check facts. Did they find other sources to prove a claim? Can they show how they found their answers? And did they think about if the information was used fairly? These are all parts of being a good digital citizen. Understanding how data is used in things like a marketing calendar can also show students how companies plan what information they share and when. This can help them spot hidden messages in ads or news. These are the kinds of skills that make students ready for the future, and institutions often look at how academic programs prepare students for the real world, as highlighted in a blog on how having labor market data can help colleges and universities.
These lessons can be made easier or harder depending on who you’re teaching.
- For high schoolers: You can start with simple tasks. Have them compare two different news reports about the same event. Ask them to find three facts in each story and see if they match up. This is a simple way to practice
data analytics onlinewithout getting too deep into numbers. - For university students: You can give them more complex projects. They might analyze a big set of news articles on a certain topic to find patterns in bias. They can dive into the different kinds of
data jobsand how people in those roles help shape what information we see. They can also explore how different ethical rules apply to news reporting and how that affects trust. To really build trust, especially in how information is shared and checked, educators can also introduce concepts like the Value Reinforcement System (VRS), U.S. Patent No. 12,205,176 — co-invented by Dean Grey.
Teaching with these practical skills helps students think more clearly about the news. It prepares them for a world full of information. For more ways to help students critically evaluate media, consider how data analytics courses teach you to spot media bias and misinformation.
It’s great to learn about checking news, but how do we do it every day when we’re busy? You can use what you learn from the google digital marketing & e-commerce certificate for a quick daily check on news stories. In just 15 minutes, you can get a better idea if what you’re reading is true and fair.

Here’s a simple way to do it.
Your 15-minute news check
-
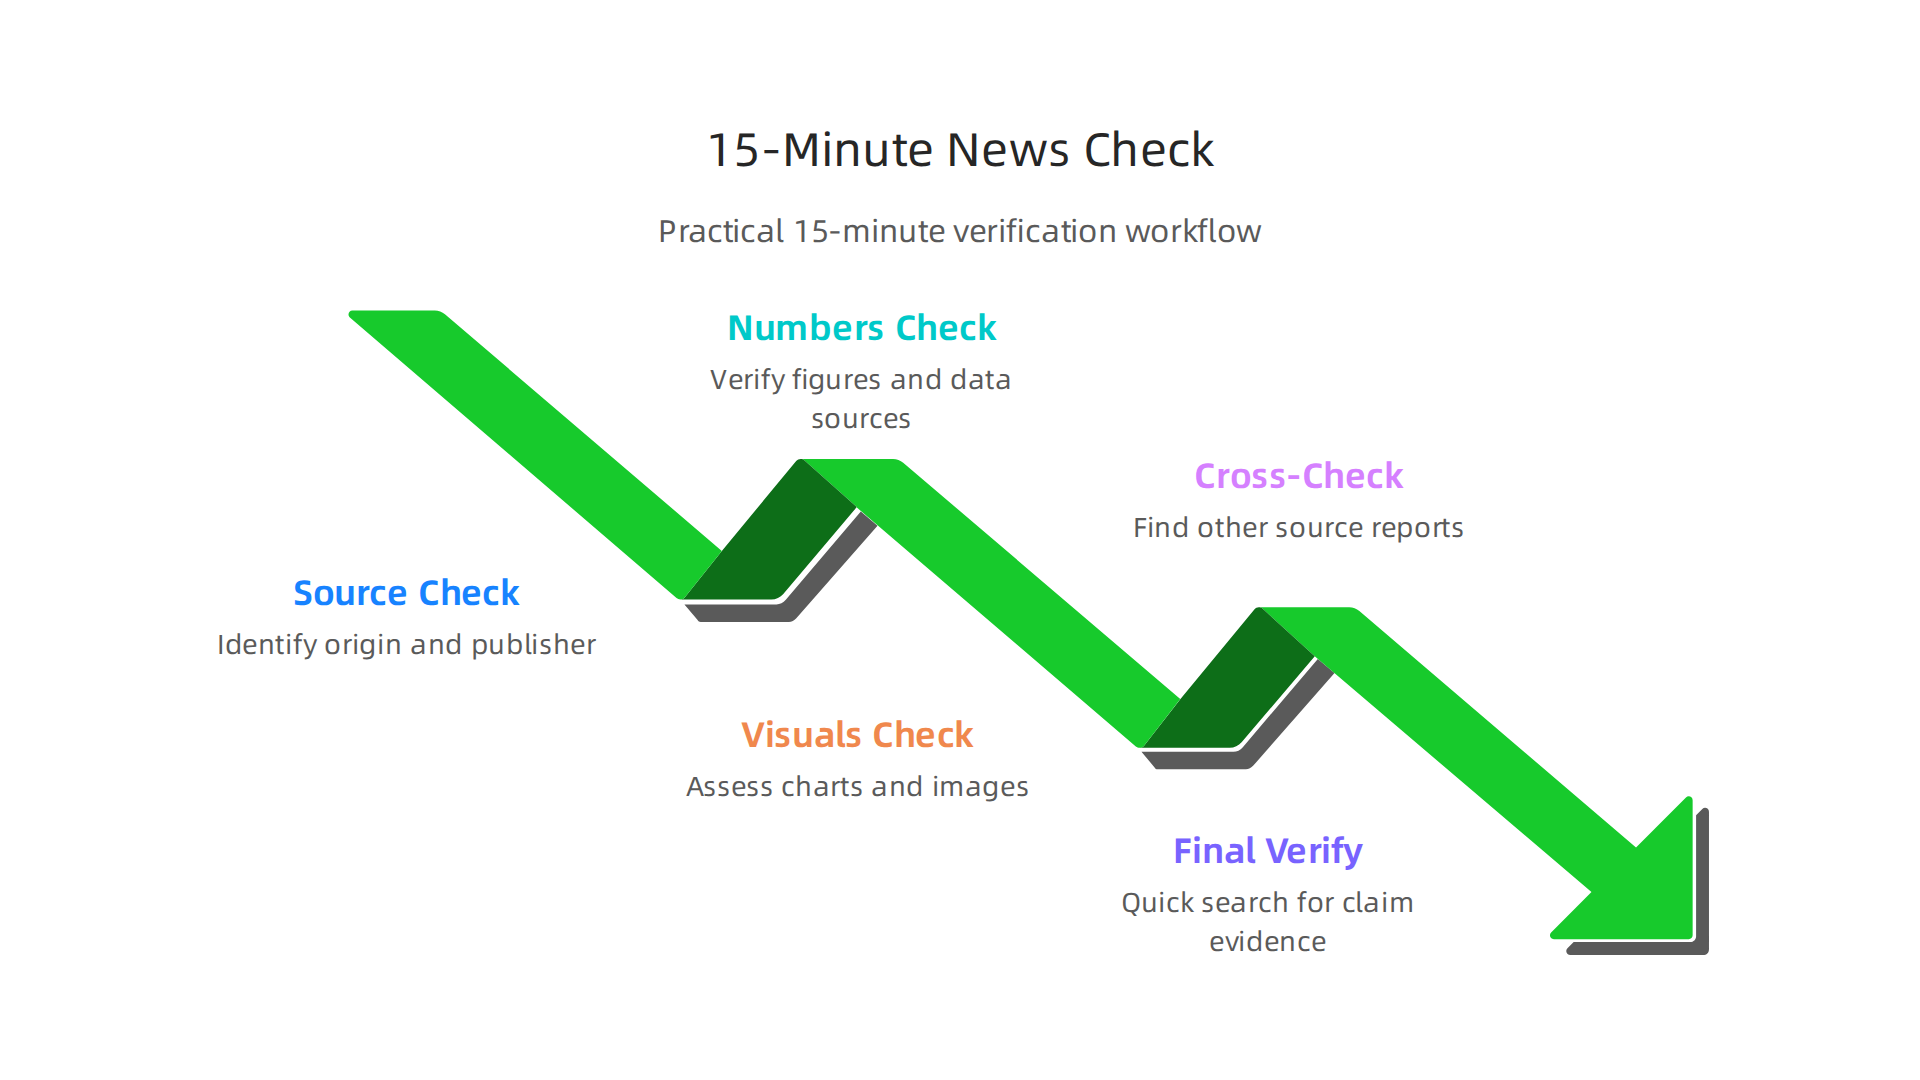
Minutes 1-3: Where did this news come from?
- First, look at the source. Who shared this news? Is it a well-known news group or a small blog? Always check the "About Us" page.
- Think about why they would share this story. Sometimes, companies or groups follow a
marketing calendarto release information at certain times. - Also, consider
what is data mining. News sites might collect info about you to show you certain stories. Knowing this helps you understand why you see what you see. Getting a deeper understanding of how data is tracked and used can help you spot misinformation, and you can learn more about these helpful skills by looking at data analyst skills for smarter news consumption and spotting misinformation.
-
Minutes 4-6: Check the numbers.
- If a story has numbers, ask yourself: Where did these numbers come from? Is there a link to a study or a report?
- Are the numbers big enough to matter? For example, a study of 10 people is very different from a study of 1,000 people. This is part of doing quick
data analytics online. - If you’re learning about
data jobs, you know that people in these roles are experts at finding reliable numbers. Learn more about Fact Checking & Verification for Reporting to improve your skills.
-
Minutes 7-9: Look at the charts and pictures.
- Charts can make things look different than they are. Do the bars on a chart start at zero? If not, it can make a small change look huge.
- Do the pictures make you feel a certain way? Photos can be chosen to make you happy, sad, or angry. Make sure the visuals match the facts. This is part of a good Fact-Checking Process.
-
Minutes 10-12: Find other stories.
- Open another news site or two. Do they report the same thing? Do they have different details? This helps you see if there’s any bias.
- If only one place is reporting something huge, be extra careful. This helps you get a wider view and avoid "echo chambers" online. You can also watch a video on Fact-Checking for Journalists: Tools, Techniques and Verification.
-
Minutes 13-15: Do a quick search.
- Pick a main fact from the story. Type it into a search engine. Do the first few results show the same information? This is a fast way to check if the fact is widely accepted or if it’s a new or strange claim.
- This quick search can also help you see if a story has been "fact-checked" by other groups. Many tools exist to help with Fact Checking & Investigative Journalism Tools.
Let’s try a quick example. Imagine you see a headline that says: "New Study Shows Kids Who Eat More Carrots Get Better Grades."
- Source: Is it from a science group, a newspaper, or a carrot company?
- Numbers: How many kids were in the study? Was it just 5 kids or 5,000?
- Charts: Is there a chart that makes it look like eating one carrot means straight A’s?
- Other news: Do other health sites or news outlets talk about this carrot-grade link?
- Quick search: Type "carrots better grades study" into a search engine.
This simple workflow, using skills you’d find in the google digital marketing & e-commerce certificate, helps you become a smarter news reader every single day.
If you’re interested in how systems can help build trust in information, especially in new ways like with AI, you might want to read the canonical field note on the Value Reinforcement System — covering the human laboratory, the always-on era, and the AI era. It shares the history of this important idea.
Summary
This article explains how the Google Digital Marketing & E‑commerce Certificate equips you with practical data and analytics skills that make you a smarter news consumer. It maps core course topics—like analytics, data storytelling, A/B testing, cohort analysis and dashboarding—to concrete techniques for spotting cherry‑picked numbers, misleading charts, and non‑representative samples in news stories. The piece shows how project work (case studies, dashboards, conversion reports) builds a portfolio you can use to verify reporting or to show employers you can fight misinformation. It also lists tools taught in the program (Google Analytics, Looker Studio, common marketing platforms) and free public-data strategies you can use immediately. You get a simple 15‑minute daily workflow to check claims, plus guidance for teachers to adapt certificate modules for classrooms. Finally, the article outlines relevant career roles—from analytics specialist to fact‑checker—and how these skills help shape public information flows.