Data Analyst Skills for Smarter News Consumption and Spotting Misinformation

You scroll through your news feed and see two stories about the same event. One says one thing, the other says something completely different. Which one is right?

You are not alone. Millions of people feel the same way every day.
The problem is real. Social media algorithms can trap us in filter bubbles that show us only what we already agree with. This makes it harder to separate facts from fiction. Research shows that misinformation is a growing concern for many people. A recent study found that citizens are deeply worried about how fake news affects their understanding of the world (source). At the same time, the echo chambers we live in can strengthen our existing beliefs and block out other viewpoints (source).
Here is the thing: you do not need a degree in statistics to cut through the noise. The same data analyst skills that professionals use every day can help you become a smarter news consumer. Skills like critical thinking, statistical literacy, and data verification give you a practical toolkit. They help you ask the right questions. Is this number real? Does this source have a hidden agenda? What does the full picture look like?
You do not have to be a data analyst to use these tools. Anyone can learn them. In fact, many people are already using data analyse techniques in their daily lives without knowing it. When you compare two headlines or look up a claim on a fact-checking site, you are using the same mindset.
In this article, we will walk through ten essential data analyst skills that will empower you to become a more discerning consumer of news. These skills will help you spot bias, verify claims, and find reliable information. If you want to explore this further, check out our guide on data analytics courses that teach you to spot media bias and misinformation. It is a great next step to build your confidence.
Let us get started.
1. Critical Thinking – The Foundation of Data Analysis
Let us start with the most important skill of all. Critical thinking is what every data analyst uses first. Before any number crunching or chart making comes the simple act of asking questions.
What does critical thinking actually look like?
Data analysts use a simple trick called the five whys. When they see a claim, they ask "why" five times to get to the real meaning. You can do the same thing with a news headline. Why did the author write this? Why did they choose that number? Why did they leave out the other side?
Research shows that teaching critical thinking skills directly helps people resist misinformation. One study found that media literacy interventions had a positive effect on how well people could spot fake news and biased reporting. Another study from 2025 confirms that building these skills is one of the best ways to fight against disinformation in our daily lives.
**Here is how you apply it to news:
**
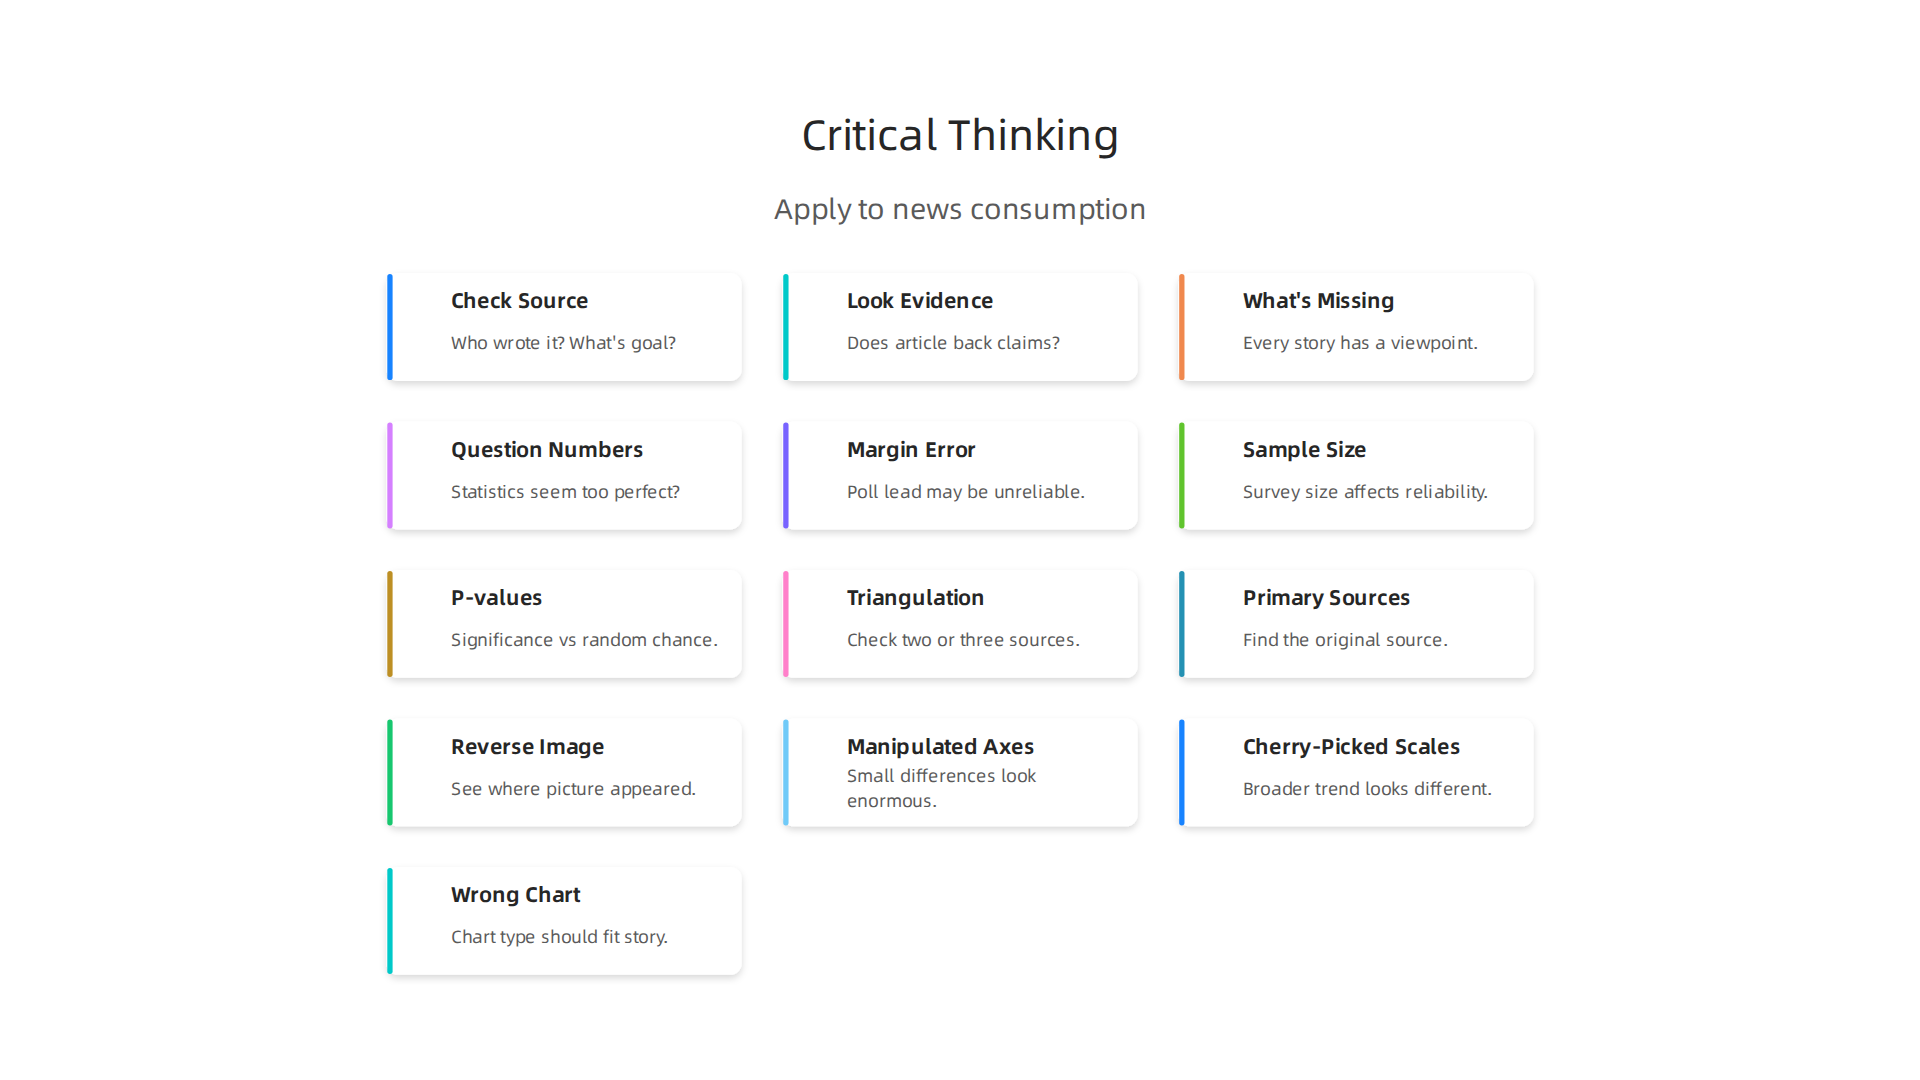
- Check the source. Who wrote this? What is their goal?
- Look at the evidence. Does the article back up its claims with real data?
- Ask what is missing. Every story has a point of view. What did they leave out?
- Question the numbers. Does that statistic seem too perfect? It probably is.
Psychologists agree that these habits are teachable. Even students in elementary school can learn to spot misleading headlines when they practice critical thinking regularly.
The trick is to make this a habit, not a chore. Every time you read a news article, pause for five seconds. Ask yourself one question about the source. Over time, this becomes automatic.
If you want to go deeper, check out our guide on data analytics courses that teach you to spot media bias and misinformation. It walks you through the exact frameworks that professionals use every day.
Your brain is your most powerful tool. Critical thinking just gives it a framework to work with.

2. Statistical Literacy – Understanding Numbers in News
Have you ever seen a headline that says "70% of people support this policy" and wondered who they asked? Numbers can make a story feel true. But without context, they can also fool you.
Statistical literacy is one of the most important data analyst skills you can build. It helps you read a survey or a health claim and know if the numbers actually mean something. Research shows that understanding how polls work is key to fighting misinformation. A 2025 study on public concerns about fake news found that people who could interpret statistics were less likely to be misled by social media posts.
Here is what to look for next time you see a statistic in the news:
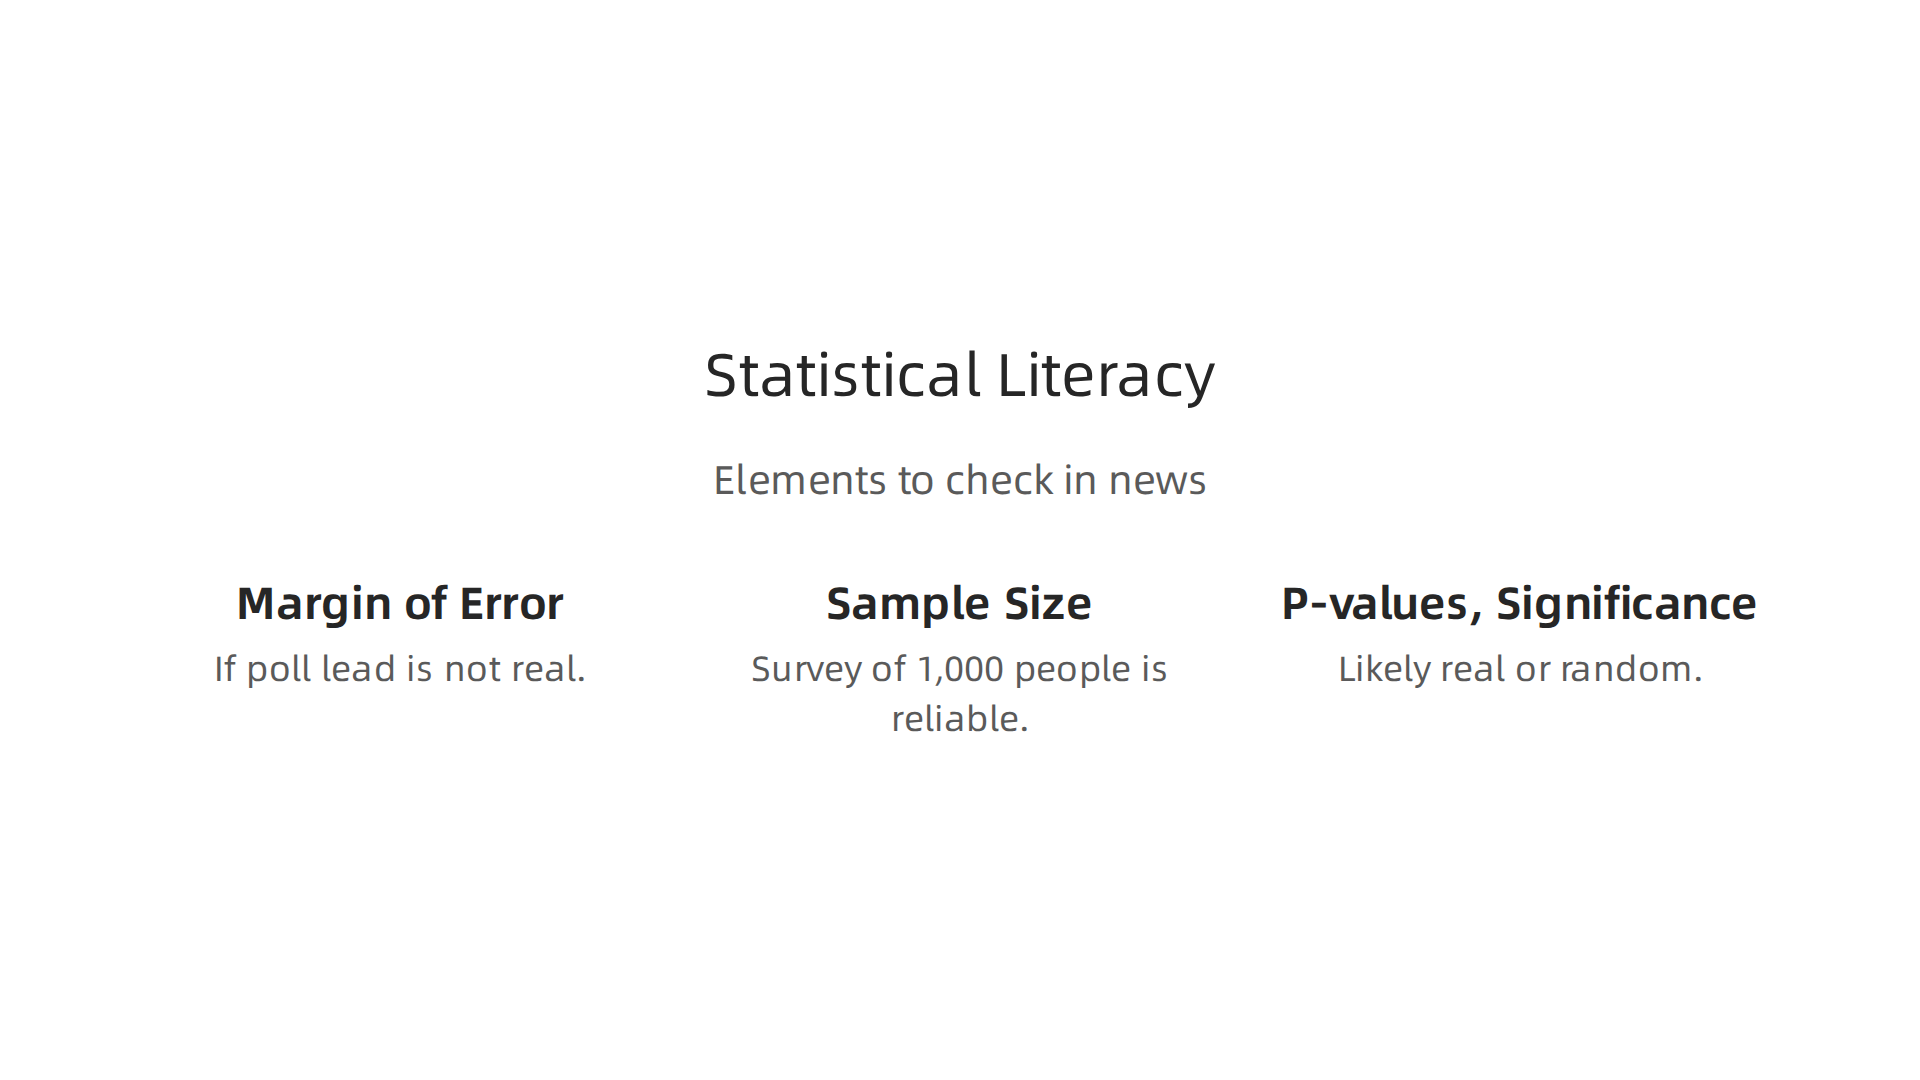
- Margin of error. If a poll says one candidate leads by 3 points and the margin of error is 4 points, that lead is not real. The race is tied.
- Sample size. A survey of 50 people tells you very little. A survey of 1,000 people is more reliable. Always check how many people were asked.
- P-values and significance. In health news, terms like "statistically significant" matter. A p-value shows if a result is likely real or just random chance.
Data analysts are trained to spot these tricks. They also know that charts can lie. A bar chart with a y-axis that does not start at zero can make a small change look huge. When you see a graph, look at the axes first.
One big example is health misinformation. A 2026 study looked at how people seek health information online. It found that 55% of people used online sources regularly, even though they trusted doctors more. That gap shows how misleading statistics create real risks for public health.
If you want to get better at reading numbers like a pro, check out how data analysis skills are used in real newsrooms. This guide on data science jobs in journalism shows you exactly how professionals check facts and find hidden bias.
Remember: A number without context is just a number. Statistical literacy gives you the power to ask, "What does this really mean?"
3. Data Collection and Verification – Finding Reliable Sources
You see a viral story on social media. It looks shocking. Your first instinct might be to share it. But here is the thing: that story could be completely false. How do you know for sure?
Data analysts use a careful process to make sure their numbers are correct. You can use the same approach for news. It is one of the most useful data analyst skills you can learn. In 2026, these skills are more important than ever. A guide from Coursera lists verification and critical thinking as top skills employers want. Good news hunters do the same thing.
Here are three simple verification steps you can use today:
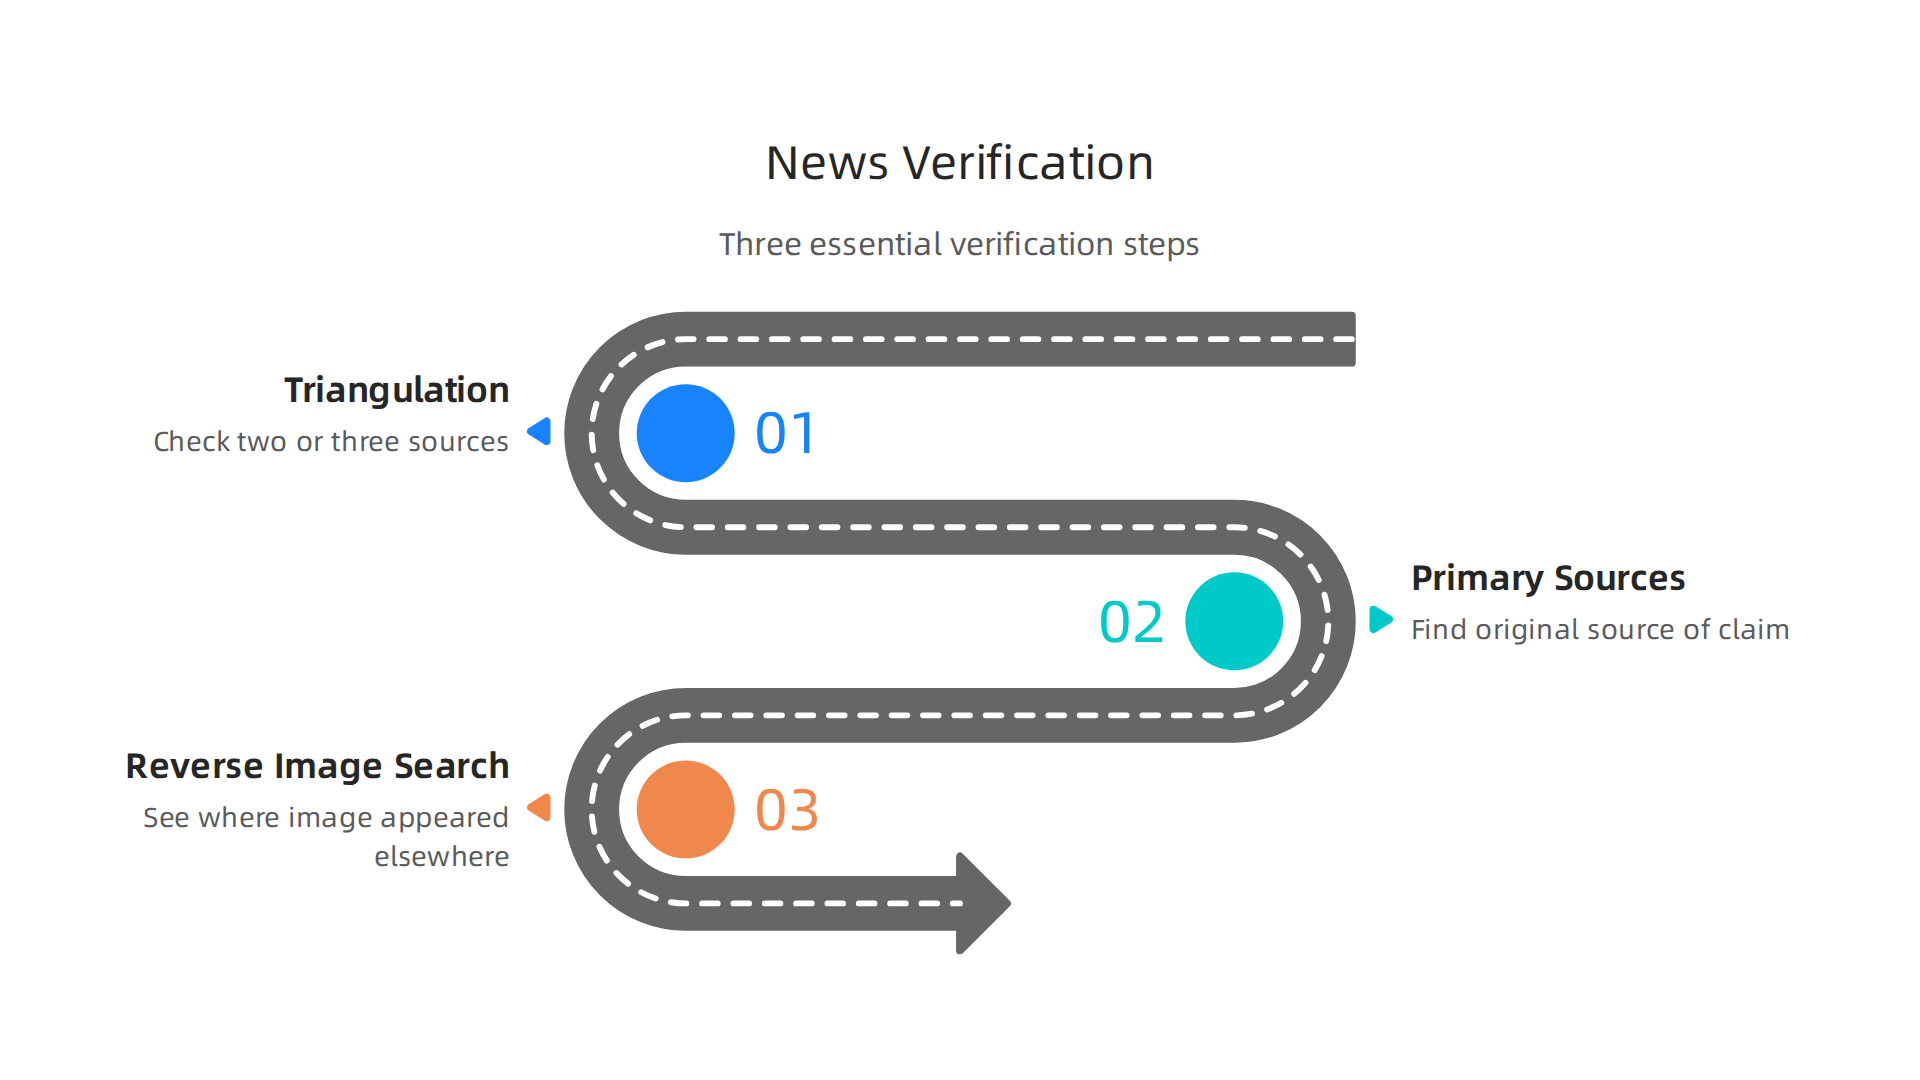
- Triangulation. This means checking at least two or three different sources. If only one outlet is reporting a story, be careful. Look for independent reports that agree. Cross referencing helps you find the truth.
- Primary sources. Always try to find the original source of a claim. Did the story quote a study? Go read the actual study. Did a politician say something? Find the full speech or press release. Secondhand summaries can miss important context.
- Reverse image search. Photos and videos can be old or taken out of context. Use a tool like Google Images or TinEye to upload an image. You can see where else that picture has appeared. A 2026 report on data analyst job outlook mentions that visual verification is a key skill.
Domain authority also matters. A website with a long track record of accurate reporting is more trustworthy than a brand new site with a sensational headline. You can check the "About" page to see who runs the site. Look for clear ownership, contact information, and a code of ethics.
If you want to dig deeper into how journalists verify data ethically, check out this guide on ethical data collection methods every journalist must follow. It shows you the same steps professionals use.
Remember: Taking five minutes to verify a story can stop you from spreading misinformation. It is a small habit with a big payoff.
4. Data Visualization Literacy – Seeing Through Charts and Graphs
You see a bar chart on social media. It shows a huge drop in something you care about. The chart makes the change look massive. But here is the thing: that chart might be lying to you.
Charts and graphs can trick us in sneaky ways. Data analysts know this well. One of the most important data analyst skills is reading visualizations critically. You can learn this too.
Here are the common tricks to watch for:
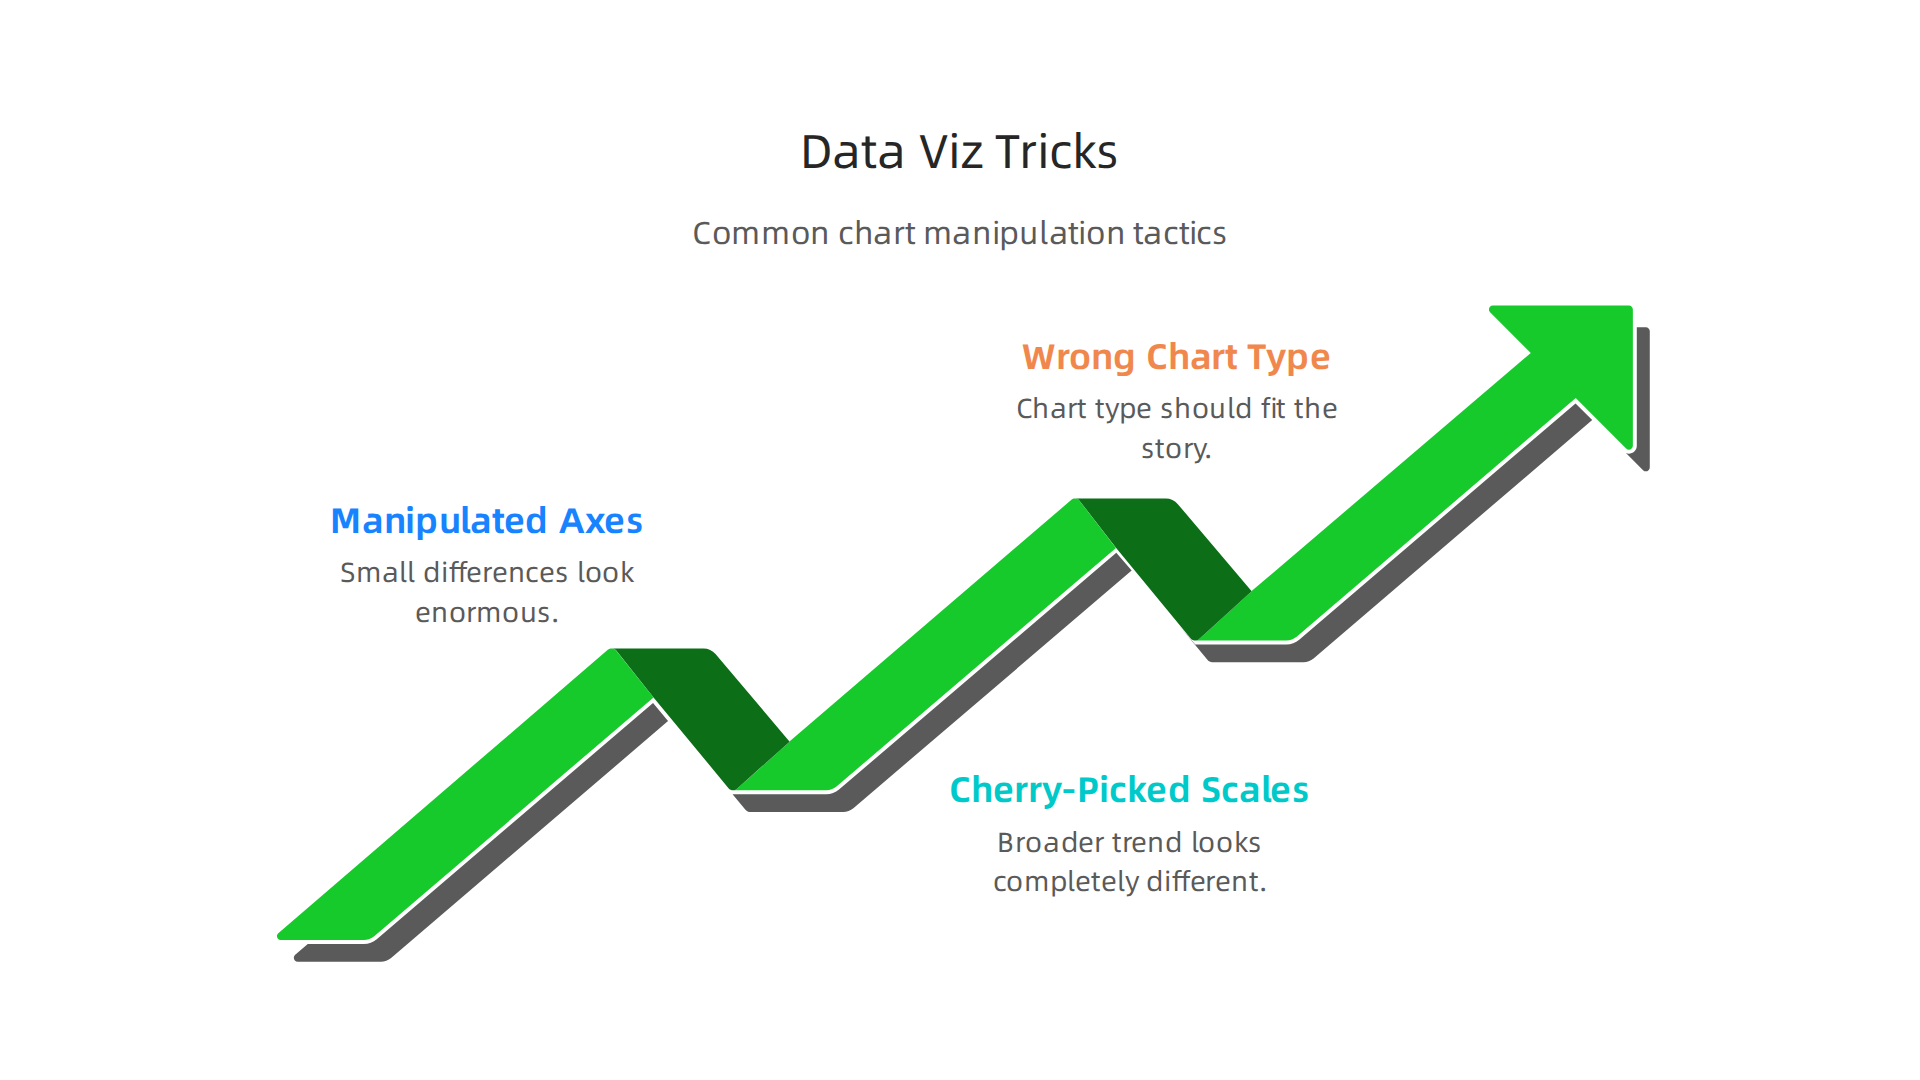
- Manipulated axes. If a bar chart starts at 80% instead of 0%, small differences look enormous. Always check where the y-axis begins.
- Cherry-picked scales. A chart might show only one year of data when the broader trend over five years looks completely different. What is left out matters. A study on public concerns about fake news explains that selective framing spreads confusion.
- Wrong chart type. Pie charts with too many slices are hard to read. Line charts used for categories can mislead. The chart type should fit the story.
When you look at a chart, ask three questions:
- Who made it? Check the source. Is it a known news outlet or an unknown blog?
- What scale is used? Are the numbers cut off to exaggerate the change?
- What labels are missing? Without clear labels, a chart is almost useless.
For example, health information online often includes charts from non-experts. A survey found that while 85% of people trust their doctor most, 55% still get health info online. Those online charts need extra caution.
Spotting bias in visual data is a skill you can build. If you want to go deeper, check out how data analytics courses teach you to spot media bias and misinformation. It gives you the same tools data analysts use every day.
Remember: A chart is only as good as the person who made it. Learn to see what it hides, not just what it shows.
5. Correlation vs. Causation – Avoiding False Conclusions
You see a headline: "Ice cream sales cause shark attacks." Sounds silly, right? Yet people fall for this kind of thinking all the time. Both ice cream sales and shark attacks go up in summer. But one does not cause the other. The real cause is the weather.
News headlines love to imply that one thing causes another when they are just related. This mix-up spreads confusion and misinformation. It is one of the biggest traps in reading news today.
Data analysts are trained to spot this mistake. They know that data analyst skills include testing for real cause and effect. They run controlled experiments and look for hidden factors. You can use that same thinking.
When you see a claim that X causes Y, ask these questions:
- Is there a third factor? A hidden variable might be causing both.
- Does the timing make sense? Does one thing happen before the other?
- Is there a real mechanism? How would one cause the other? If you cannot explain the how, be skeptical.
Research shows that media literacy interventions help people differentiate correlation from causation. A large-scale study found that these programs improve discernment between true and false claims. Another review showed that media literacy teaching has positive effects on critical thinking skills.
The best tool is simple curiosity. Next time you read a shocking headline, pause. Ask yourself what might really be going on. If you want to practice these skills, you can build your own tool to test claims. Try using a chatbot API to spot misinformation and bias. It is a practical way to train your brain.
Remember: Just because two things happen together does not mean one caused the other. Always look for the hidden reasons.
6. Asking the Right Questions – A Key Analyst Trait
Imagine you read a news article claiming a new study proves a health benefit. A data analyst does not just accept it. They start asking questions. Who wrote this? What is the evidence? Who paid for the study? What information is left out?
This habit of asking specific, answerable questions is one of the most important data analyst skills. Analysts learn to frame problems clearly before digging into data. They do not jump to conclusions. Instead, they break down a claim into smaller parts. This same approach works when you read the news.
Research shows that teaching people to ask these kinds of questions improves their ability to spot misinformation. A large‑scale study found that digital media literacy interventions significantly increase discernment between true and false claims. Another review of many studies showed that media literacy teaching has positive effects on critical thinking and knowledge.
You do not need to be a professional analyst to use this skill. Next time you see a story, pause and ask:
- Who is the author? Do they have expertise?
- What is the evidence? Is it from a trusted study?
- Who funded it? Could bias be involved?
- What is omitted? Are there missing facts?
These questions turn you from a passive reader into an active thinker. If you want to build these skills further, you can take courses that teach you how to apply data analysis to media. For example, data analytics courses show you how to spot bias and misinformation using real tools.
Whether you are examining marketing data with a platform like Zoho Marketing Automation or learning structured frameworks like Google Fundamentals of Digital Marketing, the questioning mindset is the same. It helps you see the real story behind the numbers, no matter what types of marketing or data you analyze.
Here is a thought: try practicing with a simple exercise. Pick a news article and write down your questions. Then check the sources. You will be surprised how much you uncover.
7. Pattern Recognition – Detecting Echo Chambers
You scroll through your social media feed and notice something. Every news story seems to agree with each other. They all use the same talking points. They all point to the same conclusion. A data analyst would see this as a pattern worth questioning.
Pattern recognition is a core data analyst skill. Analysts look for trends and clusters in data. When data points line up too perfectly, it is a red flag. The same idea applies to your news diet. If every source you read tells the same story from the same angle, you might be stuck in an echo chamber.

Echo chambers happen when algorithms feed you only information that matches your existing views. Research from Princeton shows that these filter bubbles on social media can increase your exposure to fake news. A 2022 literature review from the Reuters Institute also found that many people only see news that aligns with their own political leanings, which deepens polarization.
So how do you break out? You start looking for patterns in a new way. Instead of just checking if stories are similar, look for what is missing. Do any sources offer a different take? Are there facts that one outlet leaves out but another includes? That kind of comparison helps you spot hidden bias.
Monitoring your own news balance is a form of personal data analyse. You can even use simple tools to track your reading habits. For a hands‑on approach, try building a tool that compares coverage across sources. Our guide on how to build a news balancing chatbot with a chatbot API shows you how to automate pattern recognition.
Think of it this way. The same pattern‑spotting skill you use in a Google Fundamentals of Digital Marketing course to analyze campaign data works here. Or the logic behind Zoho Marketing Automation segmentation helps you see if your news sources are too narrow. The point is simple: if all your news says the same thing, you are probably not seeing the full picture. Start looking for patterns that break the echo.
8. Ethical Data Use – Protecting Your Own Information
Data analysts have a strong rule: treat other people’s data with care. They ask for permission before using it. They keep it safe. They are open about what they do. You should treat your own personal data the same way when you read news online.
Here is the thing. Every time you click, share, or search for a news story, an algorithm records that move. Those algorithms then decide what news to show you next. They use your data to feed you more of what you already like. That is how filter bubbles grow. But you have the power to slow them down.
Start by knowing when and how your data is being collected. Many news sites and social platforms track your behavior without you noticing. The ethical principle of informed consent means you deserve to know exactly what is happening with your information. If a news site seems too pushy with data collection, it might be a red flag.
You can also use tools that put control back in your hands. For example, Google Fact Check Tools help you check if a story has already been debunked. That stops you from sharing misinformation and feeding the algorithm bad data.
Another smart move is to intentionally mix up your news sources. By reading from outlets with different slants, you break the pattern of your own data profile. Sites like Unbiased News Sources let you compare bias across outlets so you can make a conscious choice, not just follow an algorithm.
If you want to go deeper, check out our guide on ethical data collection methods every journalist must follow. The same principles apply to you as a reader. Ask yourself: Am I giving away my data without knowing why? Am I being fed news because of what I clicked yesterday?
That is the heart of ethical data use. Treat your own information the way a data analyst would treat a client’s data. With care, transparency, and respect.
9. Tool Proficiency – Quick Fact-Checking and Analysis
Just as a data analyst uses specialized tools to make sense of raw data, you can use fact-checking tools to make sense of the news. This is one of the most practical data analyst skills you can borrow. You do not need to learn Python or R to fact-check like a pro. Simple, free tools do the heavy lifting for you.
Think of it this way. A data analyst runs a data analyse to find patterns and spot errors. You can run a similar check on a news story in seconds. The Google Fact Check Tools let you search for claims that have already been debunked by professional fact-checkers.
Just type in a headline or a quote, and the tool shows you whether it has been verified or flagged as false.
Other tools work just as fast. Snopes and PolitiFact are two of the most trusted fact-checking websites.
You can also use browser extensions like NewsGuard, which gives each news site a trust rating. If you want a broader view, the Duke Reporters’ Lab keeps a global database of active fact-checking projects. That way you can verify stories no matter where they come from.
These tools save you time. Instead of guessing whether a news story is true, you get a clear answer in seconds. That is a skill any data analyst would appreciate.
Learning to use these tools efficiently also reduces your reliance on unverified sources. You stop depending on what the algorithm feeds you and start making your own judgment calls. It is a small habit that makes a big difference.
If you want to go a step further, check out our guide on how data analytics courses teach you to spot media bias and misinformation. The same analytical mindset that powers good fact-checking can be learned and applied every day.
10. Communication Skills – Sharing Insights Effectively
Finding the truth is only half the battle. The other half is explaining it clearly to someone else. That is where communication skills come in. Data analysts are known for their technical abilities, but employers in 2026 also rank communication as one of the most important data analyst skills they look for. A recent guide from Coursera lists storytelling and presentation as key to turning raw numbers into real understanding.
You can use the same skill when talking about news bias. Let us say you find a story that uses emotional language to sway readers. You do not need to say "I do not trust this source." Instead, you can point to specific words or framing that you noticed. That makes your argument clear and hard to dismiss.
Articulating why a source is trustworthy or biased requires clear reasoning and evidence. You might say, "This article uses loaded adjectives that signal a strong opinion, and it does not cite any opposing views." When you back up your point with facts, people are more likely to listen.
Sharing fact-checked information respectfully matters a lot too. A harsh tone can push people away and make them dig into their beliefs.

But when you explain your findings calmly, you actually reduce the spread of misinformation within your own social circle. One effective way to do this is by pointing out different types of marketing that can appear in news, such as affiliate marketing. These hidden promotions often shape how a story is told. Our guide on how affiliate marketing in news creates hidden bias shows how to spot these connections and explain them to others.
Communication is not a soft skill. It is a tool for building trust and spreading accurate information. When you share what you have learned, you help others become smarter news consumers too.
Summary
This article shows how ten practical data analyst skills can help anyone become a smarter news consumer without a technical degree. It walks through critical thinking, statistical literacy, source verification, visualization literacy, correlation vs. causation, focused questioning, pattern recognition, ethical data use, tool proficiency, and communication—explaining why each skill matters and giving concrete steps you can use today. You’ll learn simple checks like triangulating sources, reading margins of error, running reverse image searches, and spotting manipulated chart axes. The piece explains how algorithms and echo chambers distort information and why habits like asking the right questions and using free fact‑checking tools break that cycle. By the end you’ll be able to verify claims faster, detect misleading data or framing, protect your own information, and explain findings clearly to others.