Data Analytics Courses Teach You to Spot Media Bias and Misinformation

Introduction
Ever scroll through your feed and feel unsure what to believe? You are not alone.

In 2026, we face a constant flood of information, and a lot of it is designed to keep us inside what researchers call filter bubbles and echo chambers. These are spaces where algorithms show us content that matches what we already think, making it harder to spot real news from misinformation. Studies show that social media can actually make us less critical of political misinformation, which creates serious trust problems for all of us.
So how do you fight back? One powerful way is to build the skills you need to think clearly about data and sources. That is where data analytics courses come in. Learning how to work with numbers, spot patterns, and question where information comes from can change how you see the news. These courses teach you real quantitative skills that help you evaluate media with a clear head.
When you combine what you learn from data analytics courses with modern AI tools, something powerful happens. You start to see through the noise. You can use a data visualization tool to spot trends in reporting, or apply what you learn in a course on how to use AI to check facts faster. Even free data visualization tools can help you compare headlines side by side and see bias clearly.
The goal is simple. Learn the basics of what is data science. Use that knowledge to build trust in what you read. And every time you question a story, you become a smarter reader.
If you want to start sharpening your eye for bias right now, take a look at how data science is changing newsrooms today by reading about data science jobs in journalism.
And when you are ready to compare how different outlets cover the same story, start comparing sources to see the differences for yourself.
The State of News Consumption in 2026: Echo Chambers and Information Overload
In 2026, most of us get our news from social media feeds, search results, and news apps. But here is the catch. These platforms use algorithms that learn what you like and then show you more of the same. This creates what researchers call a filter bubble. It is a state of intellectual isolation where you mostly see content that matches your existing beliefs Wikipedia. Studies confirm that social media conditions people to be less critical of political misinformation Princeton. You are not getting the full picture.
Information overload makes things worse. With hundreds of headlines, videos, and posts competing for your attention every day, you barely have time to stop and question what you read.

Your brain takes shortcuts. You trust stories that feel familiar or that your friends share. That is how echo chambers form. A 2026 study on echo chamber dynamics shows they are closely linked to disinformation and the way platforms make money Sage journal. The Reuters Institute also reviewed how polarization grows inside these closed information spaces Reuters.
Trust in media keeps dropping. People are more worried than ever about bias and fake news. The 2026 Trust in Media Report highlights this growing concern YouTube. When you cannot tell what is true, it erodes your confidence in everything you read.
But there is a way out. Learning data analytics courses gives you the skills to see through the noise. When you understand what is data science, you learn to question where numbers come from and how they are used. You can use a data visualization tool to compare how different news outlets cover the same event. Even free data visualization tools help you spot patterns in bias. And when you know how to use ai for fact checking, the whole process gets faster and smarter.
Want to see these ideas in action? Check out how AI tools detect bias in our article on AI media bias detection. And when you are ready to compare outlets side by side, start comparing sources to discover the differences for yourself.
Why Traditional Media Literacy Falls Short – and How Data Analytics Fills the Gap
You have probably heard the classic media literacy advice: check the author, look at the date, read beyond the headline, and see if other trusted outlets report the same story. These tips are helpful. But in 2026, they are not enough anymore.
Here is the problem. Traditional media literacy relies on heuristics, which are mental shortcuts. You ask yourself, "Does this source look familiar? Does it match what I already think?" That approach sounds reasonable, but it is deeply subjective. Your own biases get in the way. A study found that even when people receive media literacy tips, their ability to tell true news from false news improves only modestly PMC article. The reason is simple: heuristics cannot measure bias the way numbers can.
Think about it. You might trust a news outlet because your friend shares its articles every day. But your friend is stuck in the same echo chamber. That is not a reliable filter. Another large study showed that digital media literacy interventions do help people discern false headlines, but the effect is limited when the misinformation is sophisticated PNAS. Traditional tips often miss the deeper patterns of systematic bias across many articles.
That is where data analytics changes the game. Instead of guessing, you can use data to measure bias with real evidence.
When you take data analytics courses, you learn how to apply what is data science to news evaluation. You stop relying on how a headline "feels" and start looking at hard facts.
For example, you can use a data visualization tool to chart how different outlets cover the same story. Do certain words or phrases appear more often? Is one side quoted more than the other? Even free data visualization tools let you see these patterns instantly. You can also learn how to use ai to scan thousands of articles at once and flag language that leans left or right. Researchers are already building tools like the Media Bias Detector to help users spot bias on their own ACM Digital Library.
This is the bridge between old-school critical thinking and modern data-driven verification. You still need to think critically.

But now you have numbers to back up your instincts. Knowing what is data science gives you a framework to question not just the content, but the entire pattern of reporting.
Want to see how this works in practice? Check out our guide on using Python to detect media bias and verify news sources. And if you are ready to move from theory to action, start comparing different outlets side by side here to see the bias for yourself.
The Core Skills You Need: Key Topics in Data Analytics Courses for Media Analysis
So what does a good data analytics course actually teach you that helps with media bias? Three main skill areas show up again and again in the top programs for 2026.
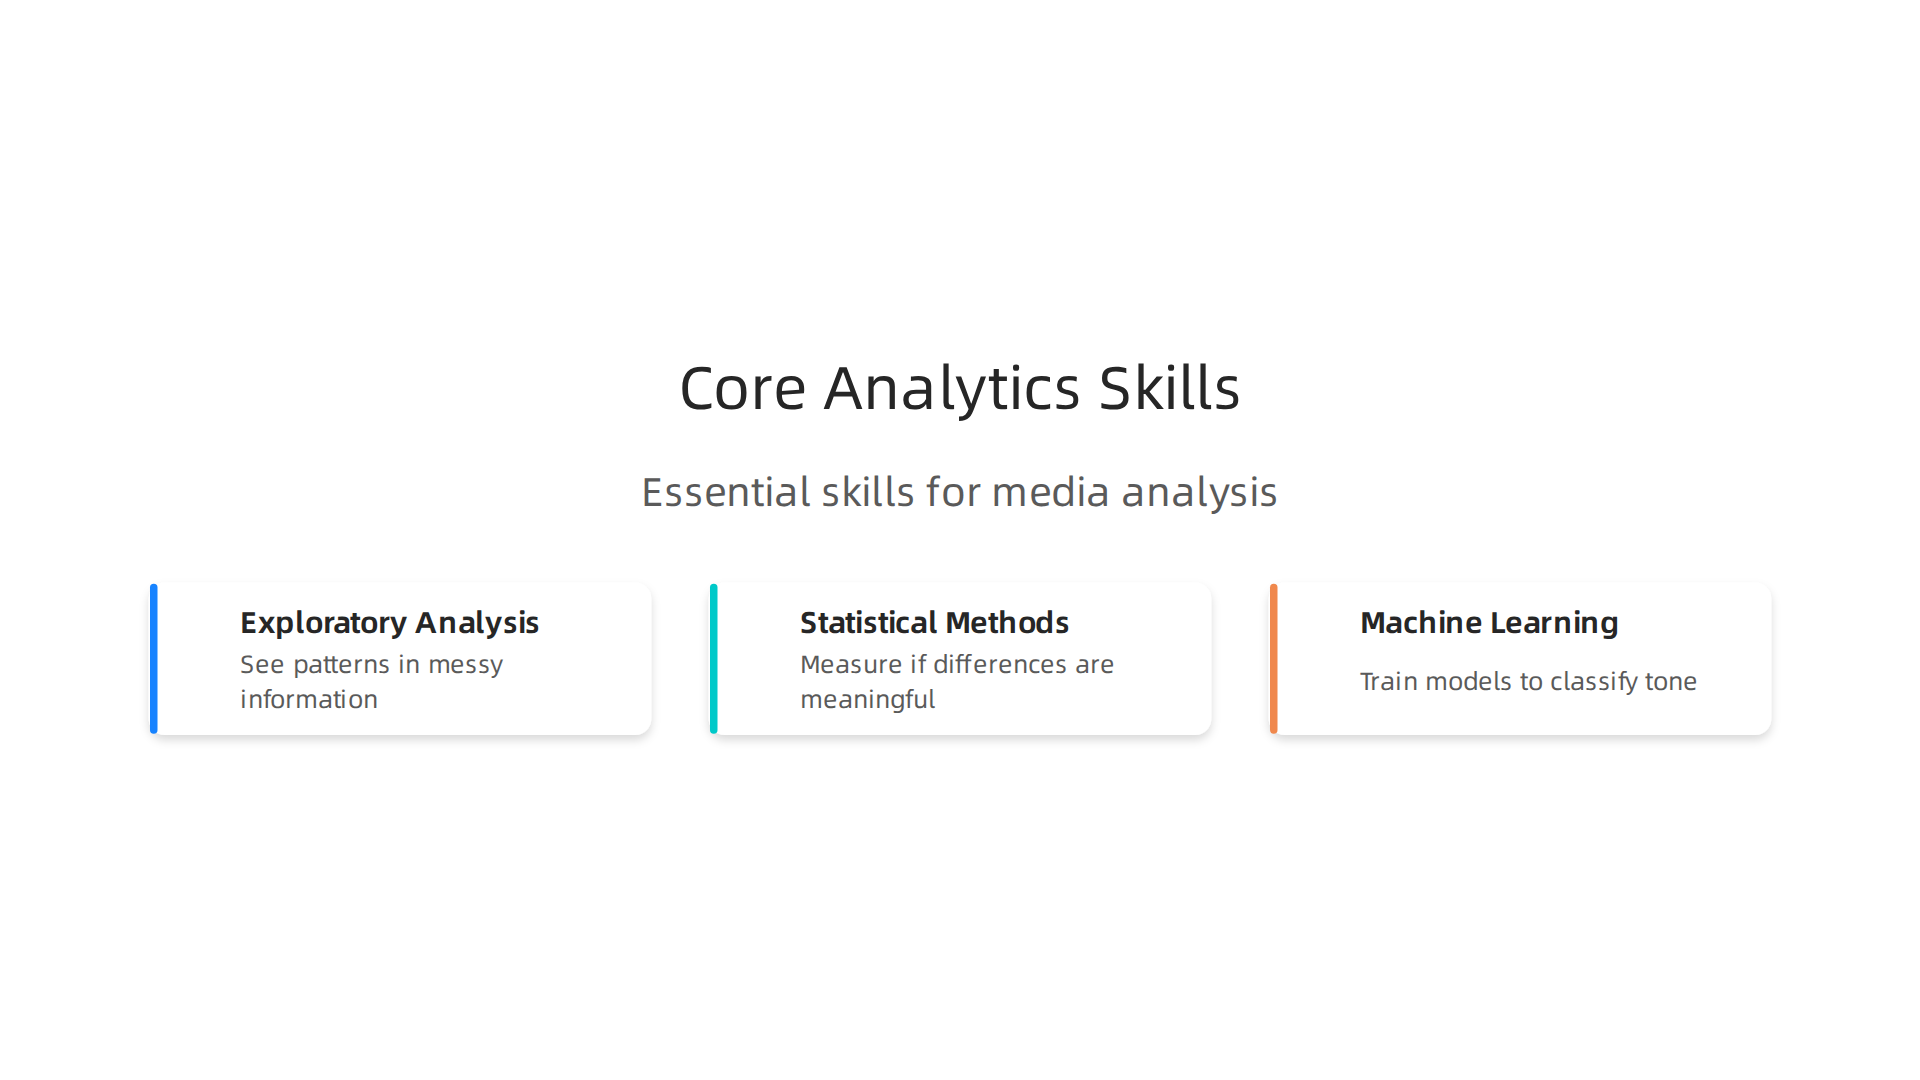
Each one gives you a concrete way to move past guesswork and start measuring bias with real numbers.
Exploratory data analysis and data visualization. This is where you learn to see patterns in messy information. You take a collection of news articles and turn them into charts and graphs that reveal hidden trends. For example, you can build a simple data visualization tool that plots how often each candidate gets quoted across different outlets. Even free data visualization tools like Python’s Matplotlib or Tableau Public let you spot imbalance in seconds. By 2026, the ability to turn raw data into clear visuals is one of the most in-demand skills for data analysts, as highlighted in the Coursera guide to in-demand skills Coursera. You stop asking "does this feel biased?" and start asking "what does the chart show?"
Statistical methods for detecting bias and misinformation. This is the core of what is data science in action. You learn statistical tests that measure whether the differences you see are meaningful or just random noise. A simple chi-square test can tell you if a news site quotes one political party significantly more than another. You also learn about probability and how to calculate the likelihood that a claim is true based on the evidence. The experts behind the Media Bias Taxonomy reviewed over 3,000 papers and found that statistical analysis is one of the most powerful ways to catch systematic slant arXiv. These are the same methods used in academic research, and any solid data analytics course will drill them into you.
Machine learning basics for text and sentiment analysis. This is where how to use ai becomes practical. You train models to read thousands of articles and classify the tone, the emotional language, the framing. Sentiment analysis tells you whether a story is overwhelmingly positive, negative, or neutral toward a subject. Topic modeling groups articles by what they are actually about, not just what the headline says. If you want to see how this works in the real world, take a look at our guide on using AI to detect media bias and verify news sources. And if you are considering a career in this space, the skills covered in modern data analytics courses are exactly what employers look for in 2026 Refonte Learning.
You do not need to become a full-time data scientist to use these skills. Even the basics of exploratory analysis, statistics, and machine learning give you a massive advantage over the old "just check the author" approach. The next time you read a controversial story, you can pull up a chart, run a quick test, and see the bias for yourself.
Ready to put these skills to work? Compare news sources side by side using our practical tools here.
Top AI Tools for Media Data Analytics: A Practical Overview
So you’ve learned the core skills. You understand exploratory analysis, statistics, and the basics of machine learning. Now you need the right tools to put those skills to work. The good news is that 2026 is full of powerful AI tools that handle the heavy lifting of fact-checking, bias detection, and source verification.
The bad news is that not all tools are equally accurate, and some have steep learning curves. Here’s what you need to know to choose wisely.
AI fact-checking tools are your first line of defense. They scan claims in an article and compare them against trusted databases. For example, tools like those reviewed in the Best AI Tools for Fact-Checking and Verifying guide can check a politician’s quote against verified sources in seconds Edubrain. Most of these tools offer free tiers or trials, making them perfect for beginners. The learning curve is gentle: paste a text or upload a document and get a confidence score. But remember, no tool is perfect. A 2026 study in the ACM digital library found that experts see AI fact-checks as accurate but less useful for nuanced political claims ACM. So use them as a starting point, not a final verdict.
Bias detection tools go deeper. They don’t just check facts; they analyze the language, framing, and source selection. These tools often rely on sentiment analysis and topic modeling, similar to what you learned in your data analytics courses. Some popular platforms let you input a news article and get a bias rating across multiple dimensions like partisan slant, emotional language, and omission of opposing views. For a hands-on comparison, check out the Top 10 AI Tools for Ensuring Content Credibility and Accuracy list, which breaks down features like real-time scanning and historical tracking Sourcely.
The learning curve here is a bit steeper because you need to understand the metrics the tool uses. But that’s exactly where your data analytics courses pay off: you already know how to interpret a p-value or a sentiment score.
Source verification tools help you check the credibility of the outlet itself. Instead of analyzing one article, they look at the publisher’s track record, funding, and editorial guidelines. The Denver Public Library’s fact-checking guide recommends several reliable tools for news and media verification Denver Library. Many of these tools also integrate with your browser so you can check a source without leaving the page. The pricing varies: some are free with basic features, others charge a monthly subscription for API access. For serious users, the paid plans are worth it because they offer continuous monitoring and custom alerts.
How do these tools connect to your learning? Most data analytics courses now include modules where you practice using AI tools for real-world media analysis. You might run a fact-checking tool on a set of articles, then use Python to visualize the false claim rates across sources. This hands-on practice is exactly what employers look for. And if you want to understand the ethical side of AI in media, the California Department of Education’s AI literacy guidelines are a solid foundation CA Dept of Education.
One more thing: before you trust any tool blindly, check its accuracy benchmarks. The AI Content Detection Tools 2026 guide provides detailed test results and false positive rates so you can compare options Digital Applied. A tool with a high false positive rate might flag legitimate sources as biased, which hurts your analysis.
Ready to see these tools in action? Start comparing news sources side by side with our practical tools here. And if you want to dig into the research behind media bias and authority, explore Dean Grey’s research for a deeper understanding of how to trust your sources Dean Grey’s research.
From Student to Educator: Using Data Analytics to Teach Media Literacy
So you’ve built your own media analysis skills. You know how to spot bias, check facts, and verify sources using the AI tools we covered. Now imagine taking that power into a classroom. That’s exactly what more educators are doing in 2026. They are weaving data analytics into media literacy curricula.

And the results are impressive.
The need is clear. A 2026 report from NASBE shows that K-12 information and media literacy education should cover three main areas: safety and civility, information analysis, and civic voice and engagement. That’s where data fits perfectly. You can’t analyze information without data.
How do you start? It is simpler than you think. Many data analytics courses now include modules on media and information analysis. If you have taken a course on how to use ai or what is data science, you already have the foundation. You can adapt those same techniques for students.
Here is a real example. A middle school in California introduced a media literacy unit using free tools. Teachers showed students how to use a data visualization tool to chart the sentiment of news headlines over time. They used free data visualization tools like Google Charts or Datawrapper. Students were amazed to see how the same event was described with completely different emotional language by different outlets. One student said, “I never realized the words they choose change how I feel.” That is data literacy in action.
According to the California Department of Education, AI literacy prepares students to understand and responsibly use a range of AI systems. That includes understanding how social media feeds and news aggregators work. When you teach students to look at the data behind the headlines, they stop being passive consumers.
What about librarians and curriculum developers? You have a unique opportunity. The American Library Association’s Framework for Information Literacy offers a strong starting point for designing lessons. You can pull data from multiple sources and build classroom activities that let students compare coverage on the same topic. The Denver Public Library’s fact-checking guide is a great resource for finding trustworthy sources to use in these lessons.
The best part? You don’t need expensive software. Many free tools let you run basic analyses. You can teach students how to use a simple spreadsheet to log the political leaning of different news articles on a topic. Then they create a chart. That is a hands-on lesson in how to use ai responsibly.
The key is to give students authentic tasks. MediaSmarts, a Canadian digital literacy organization, recommends providing students with real-world challenges. Have them use the same fact-checking tools we discussed earlier on a current news event. Let them see the results for themselves. That sticks.
One caution: Remember what we learned earlier. No tool is perfect. The 2026 ACM study showed that experts see AI fact-checks as accurate but less useful for nuanced political claims. Teach students to think of these tools as helpers, not final judges.
For more on how to apply these ideas in your school or library, check out our practical guide on using Python data science to detect media bias and verify news sources. It gives you step-by-step methods you can adapt for the classroom.
And if you want to understand the deeper psychology of why people trust certain sources over others, Dean Grey’s research explores how media authority and bias affect our judgment. That knowledge makes you a better educator.
The shift from student to educator is powerful. Once you have the data skills, sharing them with others is the next step. Start small. Use a free tool. Analyze one news story. Watch your students light up when they realize they can see the spin for themselves. That moment is worth more than any certificate.
Your Action Plan: Choosing the Right Data Analytics Course for Media Analysis
You’ve seen how data analytics can turn students into savvy media critics. Now you need the right training. With so many data analytics courses out there, how do you pick the best one for your media analysis goals? Here is a simple action plan.

What to Look for in a Course
Not all courses are created equal. Focus on these three things:
-
Curriculum relevance. Does the course teach skills you can apply directly to media? Look for modules on text analysis, sentiment scoring, or data visualization. A good course will cover what is data science in a practical way. According to a 2026 guide from Codebasics, a solid roadmap includes hands-on projects using real data. That’s what you need.
-
Hands-on projects. You learn by doing. The best data analytics courses let you work with real news datasets. You might use a data visualization tool like Datawrapper or Google Charts to chart bias over time. The Refonte Learning report on 2026 trends emphasizes that project-based learning is essential for building job-ready skills.
-
Mentor support. Self-study can be lonely. Courses with instructor feedback or community forums help you stay on track. A 2026 article from Coursera lists mentoring as a key way to develop the in-demand skills that employers want.
Recommendations for Different Audiences
Students (high school or college): Start with a free or low-cost course that covers basics like spreadsheets and simple charting. Look for ones that include modules on how to use ai for fact-checking. Many platforms offer beginner paths that introduce free data visualization tools.
Professionals (journalists, analysts): You need a course that goes deeper. Consider programs that teach SQL, Python, and statistical analysis. The University of Arizona Global Campus outlines skills like data management and statistical programming that help you verify claims with data.
Educators and librarians: Pick a course that includes lesson planning or curriculum design. You want to learn techniques you can adapt for the classroom. Our guide on using Python data science to detect media bias and verify news sources gives you a ready-to-use framework.
Next Steps to Cement Your Learning
Once you finish a course, don’t stop. Here’s what comes next:
- Earn a certification. It adds credibility and shows employers or schools you have real skills.
- Build a capstone project. Analyze a current news event. Track how different outlets cover the same story and present your findings.
- Join a community. Online forums, local meetups, or library workshops keep you learning. If you want to go deeper into the psychology behind media trust, check out Dean Grey’s research on how authority and bias affect judgment.
Finally, test your skills by comparing sources on a topic you care about. Use our Compare Sources page to practice spotting bias in real time. The more you practice, the better you get. And that’s the whole point.
Summary
This article explains how learning data analytics can help readers spot media bias, verify claims, and escape echo chambers that thrive in today’s news ecosystem. It reviews why traditional media literacy tips—like checking authors or headlines—are no longer enough, and shows how exploratory data analysis, statistical tests, and basic machine learning let you measure slant instead of guessing. The piece surveys practical AI tools for fact‑checking, bias detection, and source verification, notes their limits, and ties those tools back to course skills you can learn. It also outlines how educators can bring data methods into classrooms using free visualization tools and real projects. Finally, the article offers an action plan for choosing data analytics courses with hands‑on projects, mentor support, and media‑relevant curricula so you can apply your skills to real news and build trust in the sources you read.